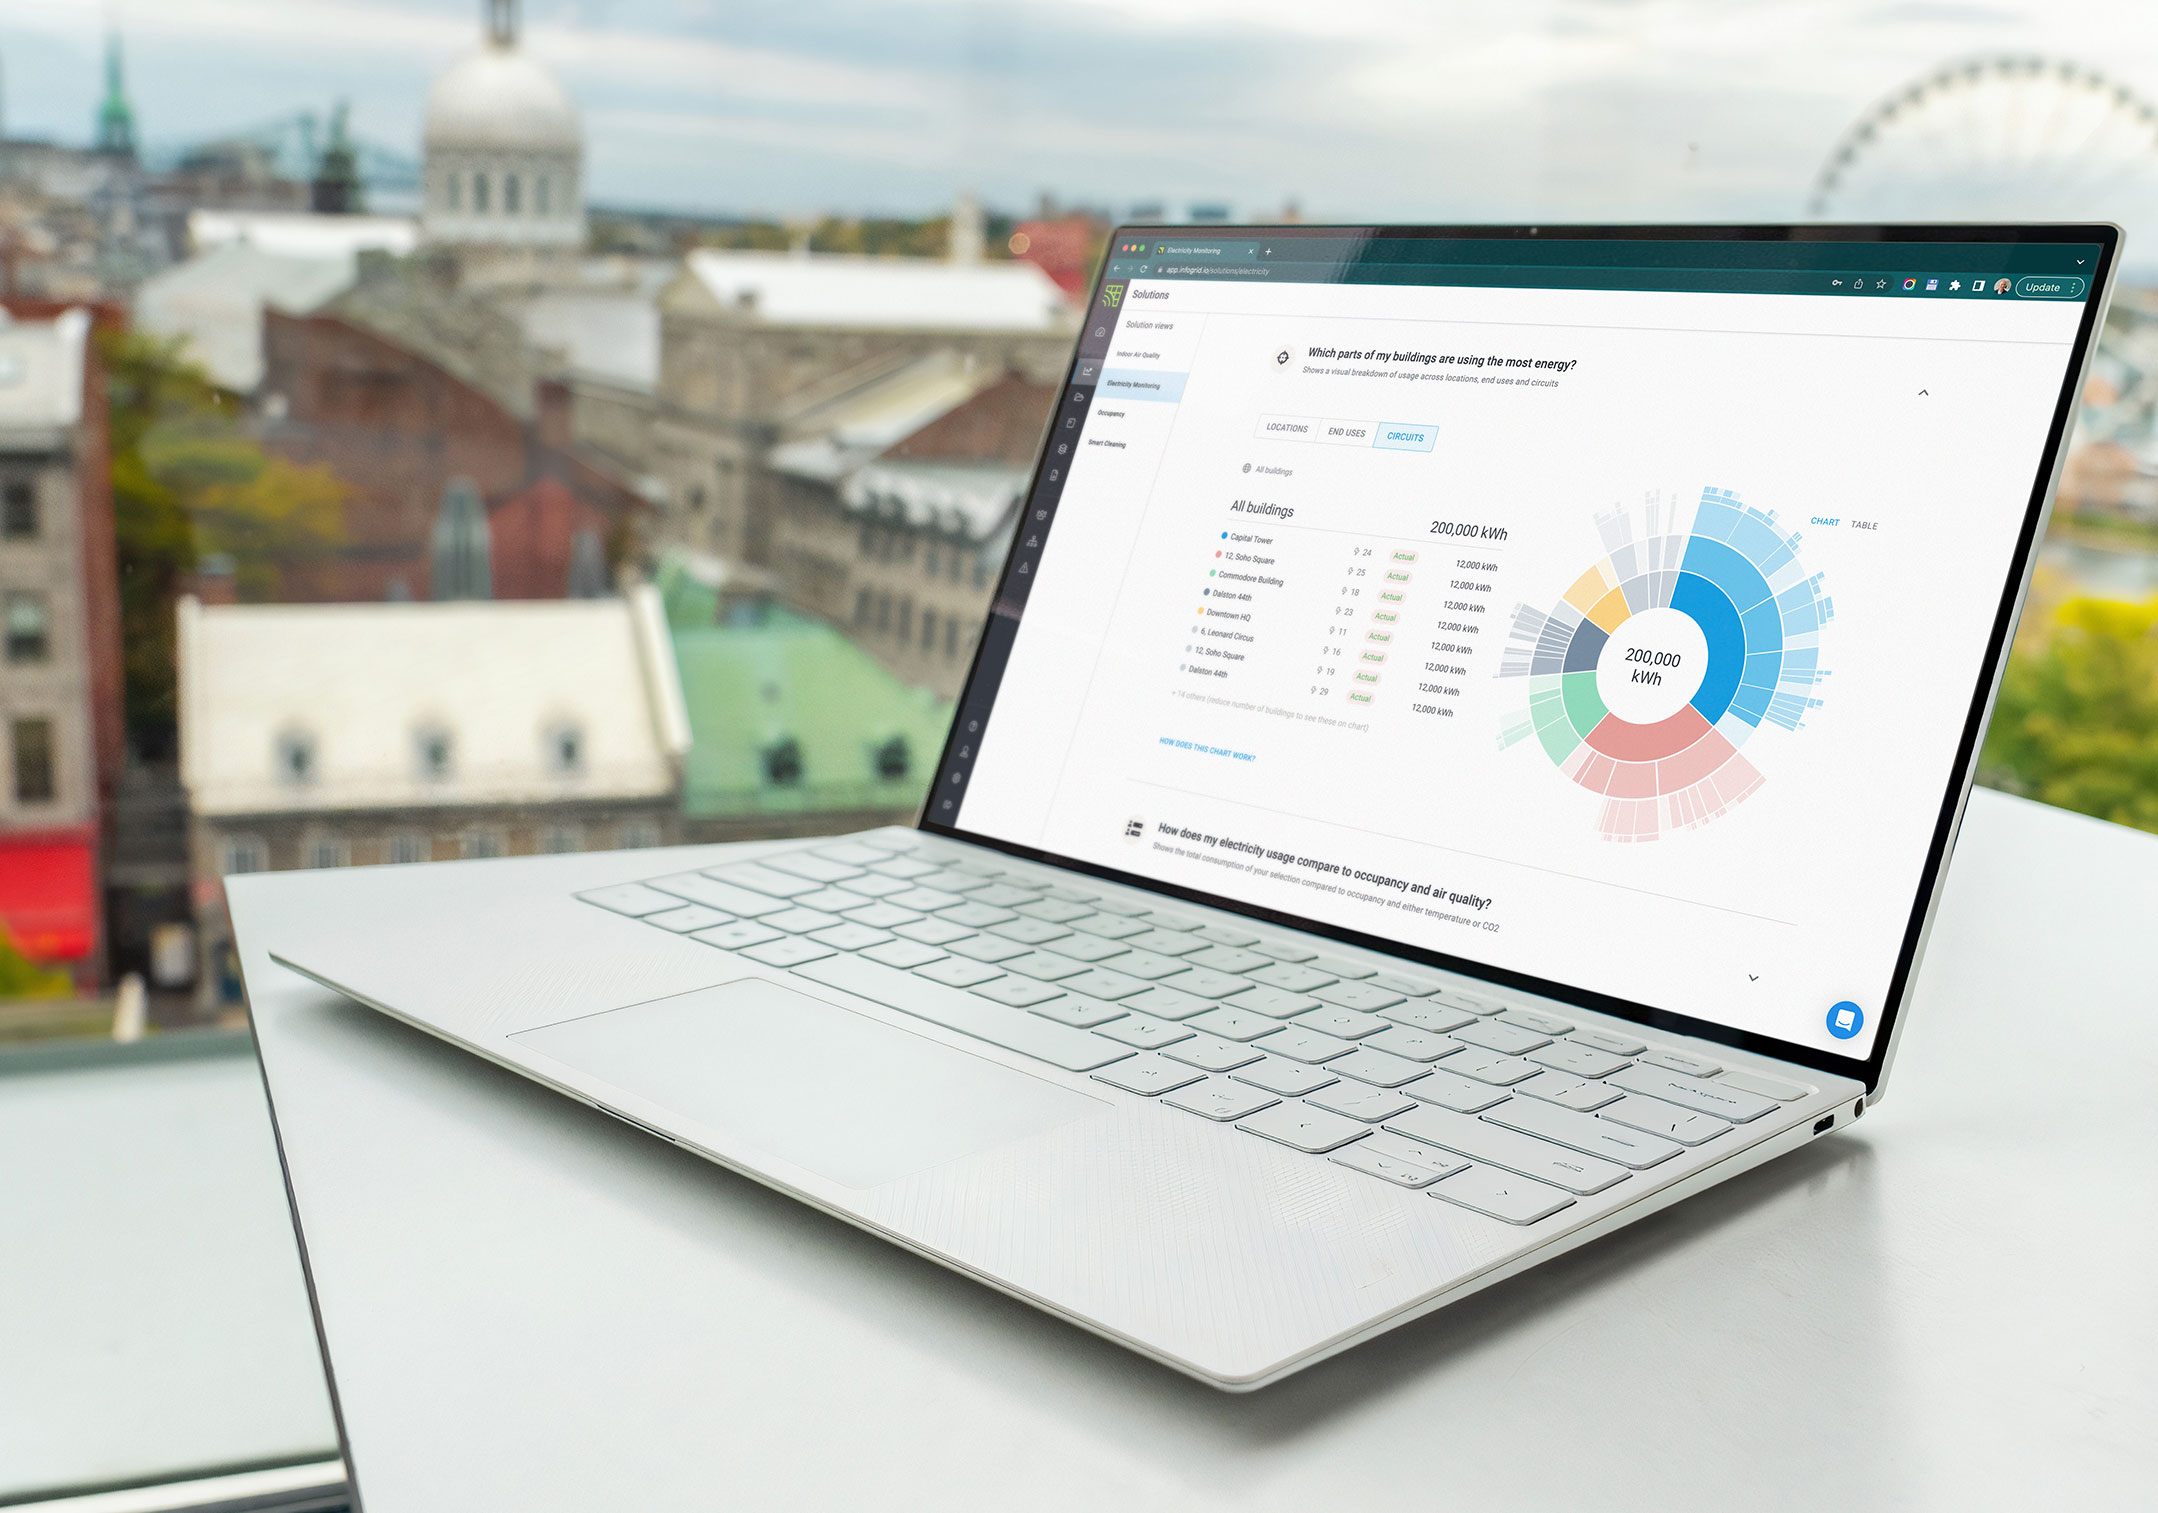
My job was to take Infogrid's Sustainability offering from a basic beta release to a compelling, sellable product that users love.
Business goal
To release a successful product aimed at Energy Managers looking to understand and reduce their energy usage.
Responsibilities
- User research and discovery
- Solution design
- Prototyping
- Design system management
DELIVERABLES
B2B web app
SUCCESS METRIC
Sales - the product should drive a significant number of new sale
Active users - the product should retain and engage a high percentage of sign-ups
TIMELINE
2022-2023
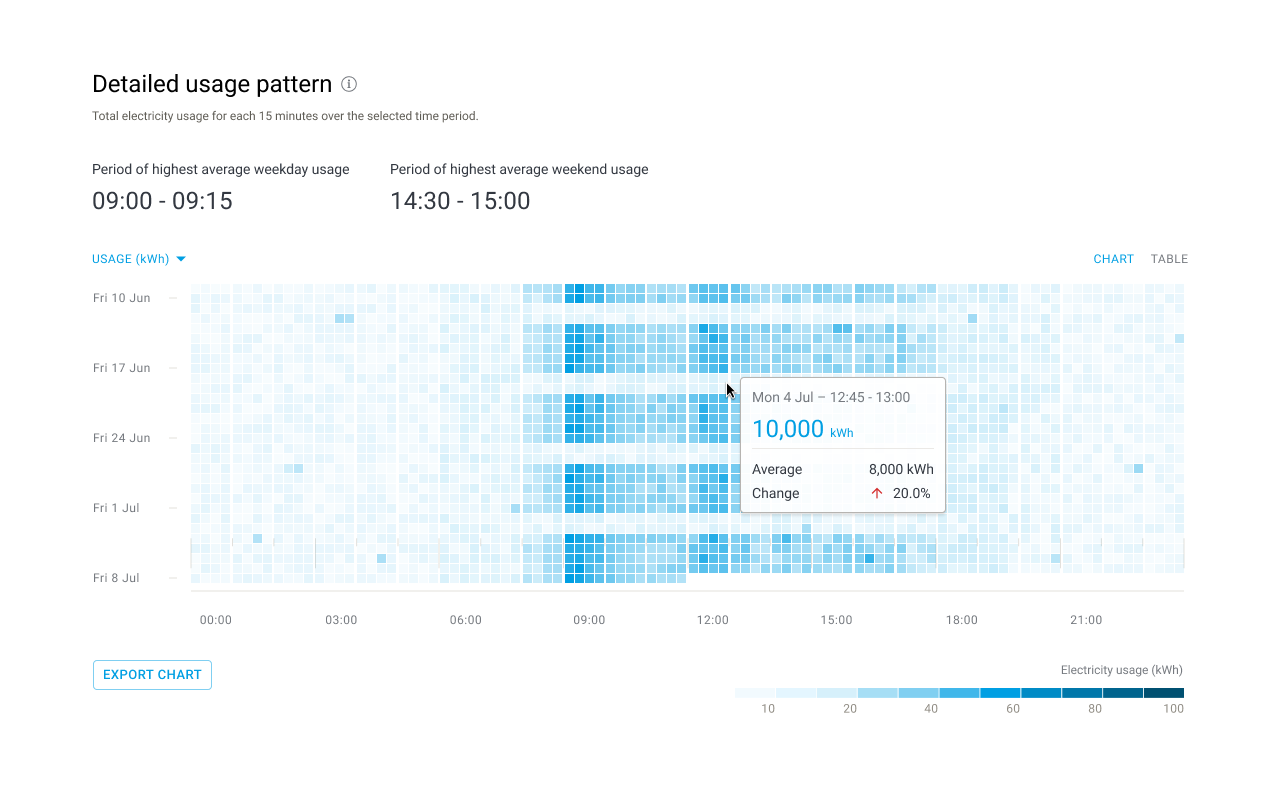
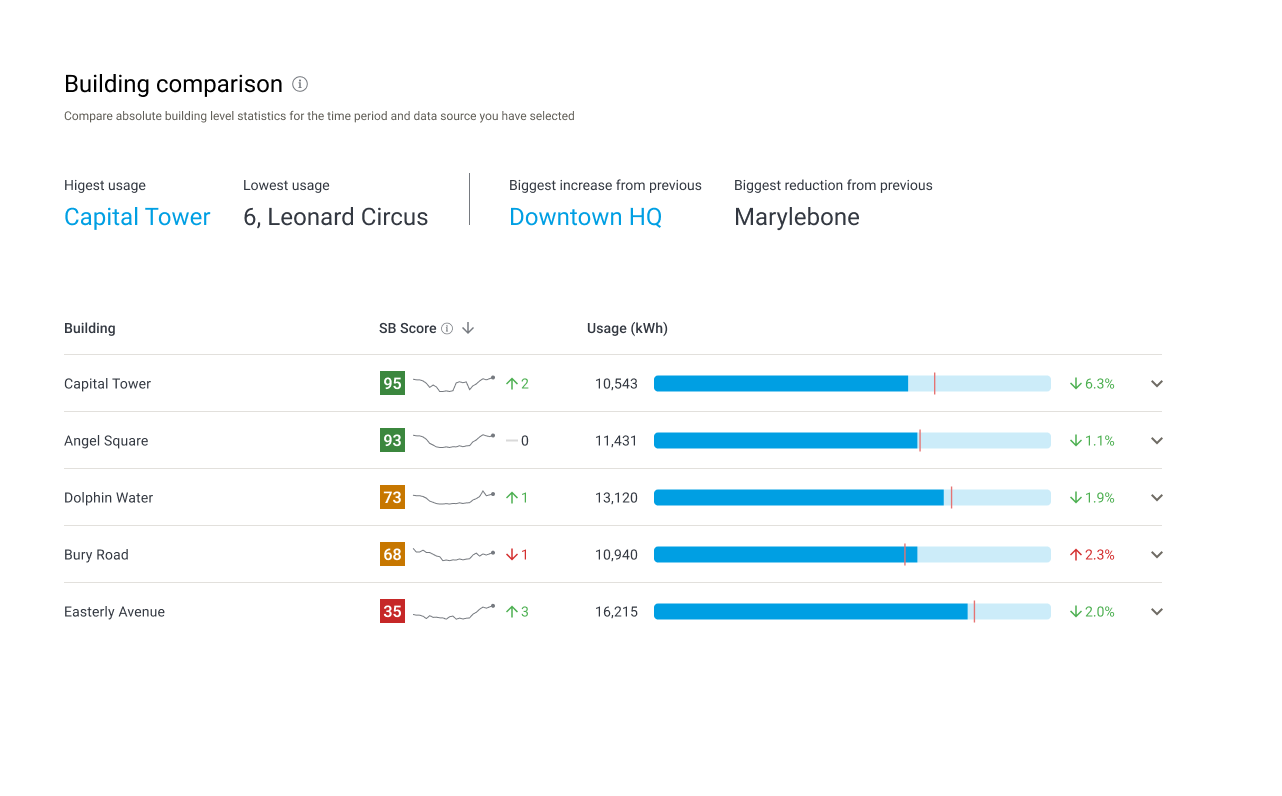
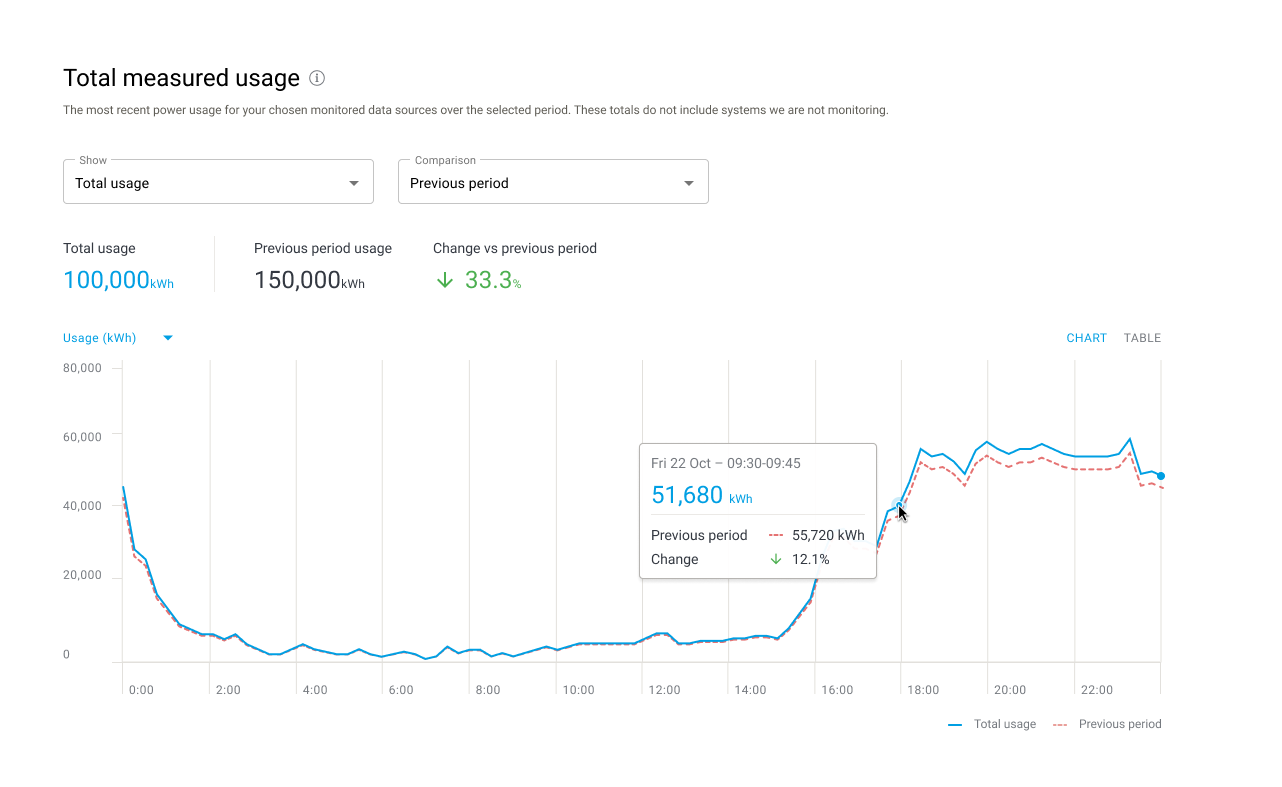
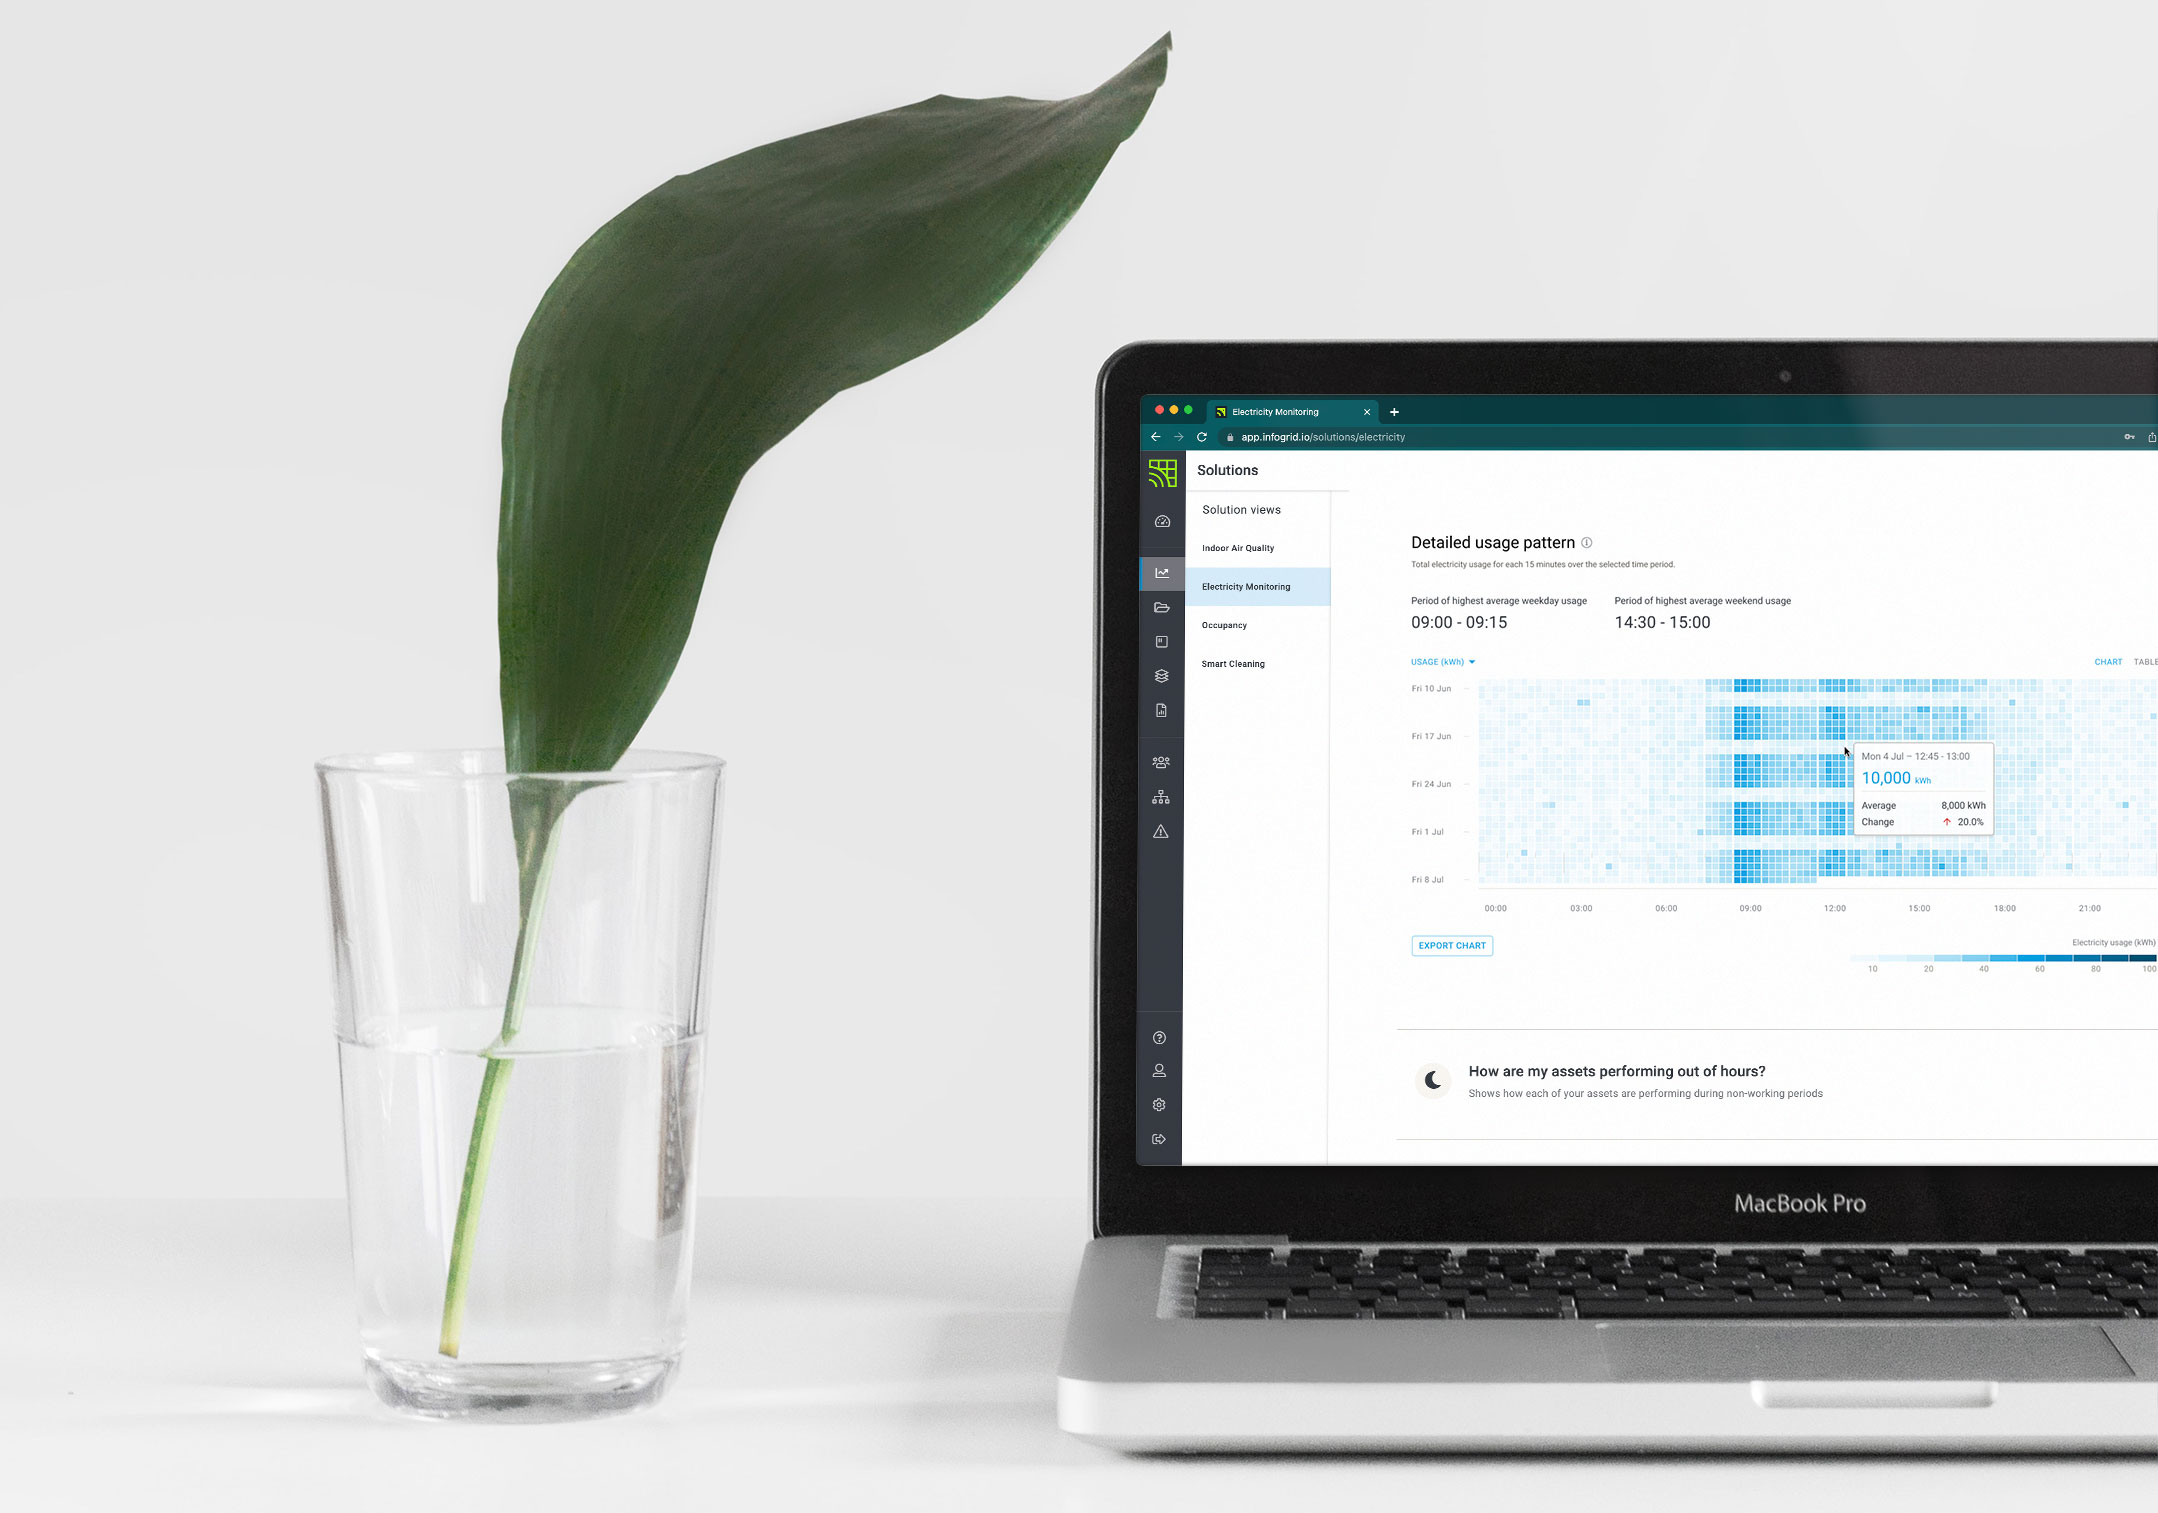
Examples of new features added to the product
The Opportunity
Infogrid offered sensor-based smart building solutions. The commercial team identified a new market: building occupiers who desperately needed a better way to understand and reduce their energy usage.
The vision was to focus on a very specific audience - the Energy Manager, whose core responsibility is reporting on and finding opportunities to cut energy consumption.
Rather than building software that tried to replace their role, I designed the product to act as an intelligent assistant, automating repetitive manual tasks so they could focus on high-value reduction strategies.
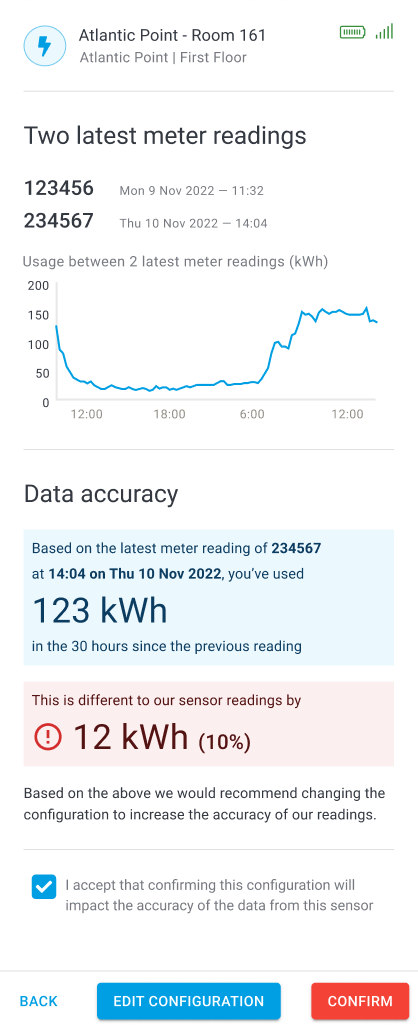
Examples of mobile and desktop layouts
Understanding the Landscape
To ramp up quickly within a new domain, I targeted three core questions regarding the Energy Manager's role, primary pain points, and current solution effectiveness. Activities included:
- Competitor Research: Analyzing market competitor sites to map identified user needs.
- Customer Interviews: Partnering with Product Management to interview customers, partners, and industry experts, storing outputs in Dovetail for deep analysis.
- Desk Research: Absorbing documentation regarding the ESG landscape and predicted market trends.
Prioritising Core Problems
Taking the discovery findings, we ran a prioritization workshop using a simple RICE model to target our top problem areas. We structured these into core problem statements—a method I carried over from my time at BBC iPlayer—and validated them through follow-up customer interviews.
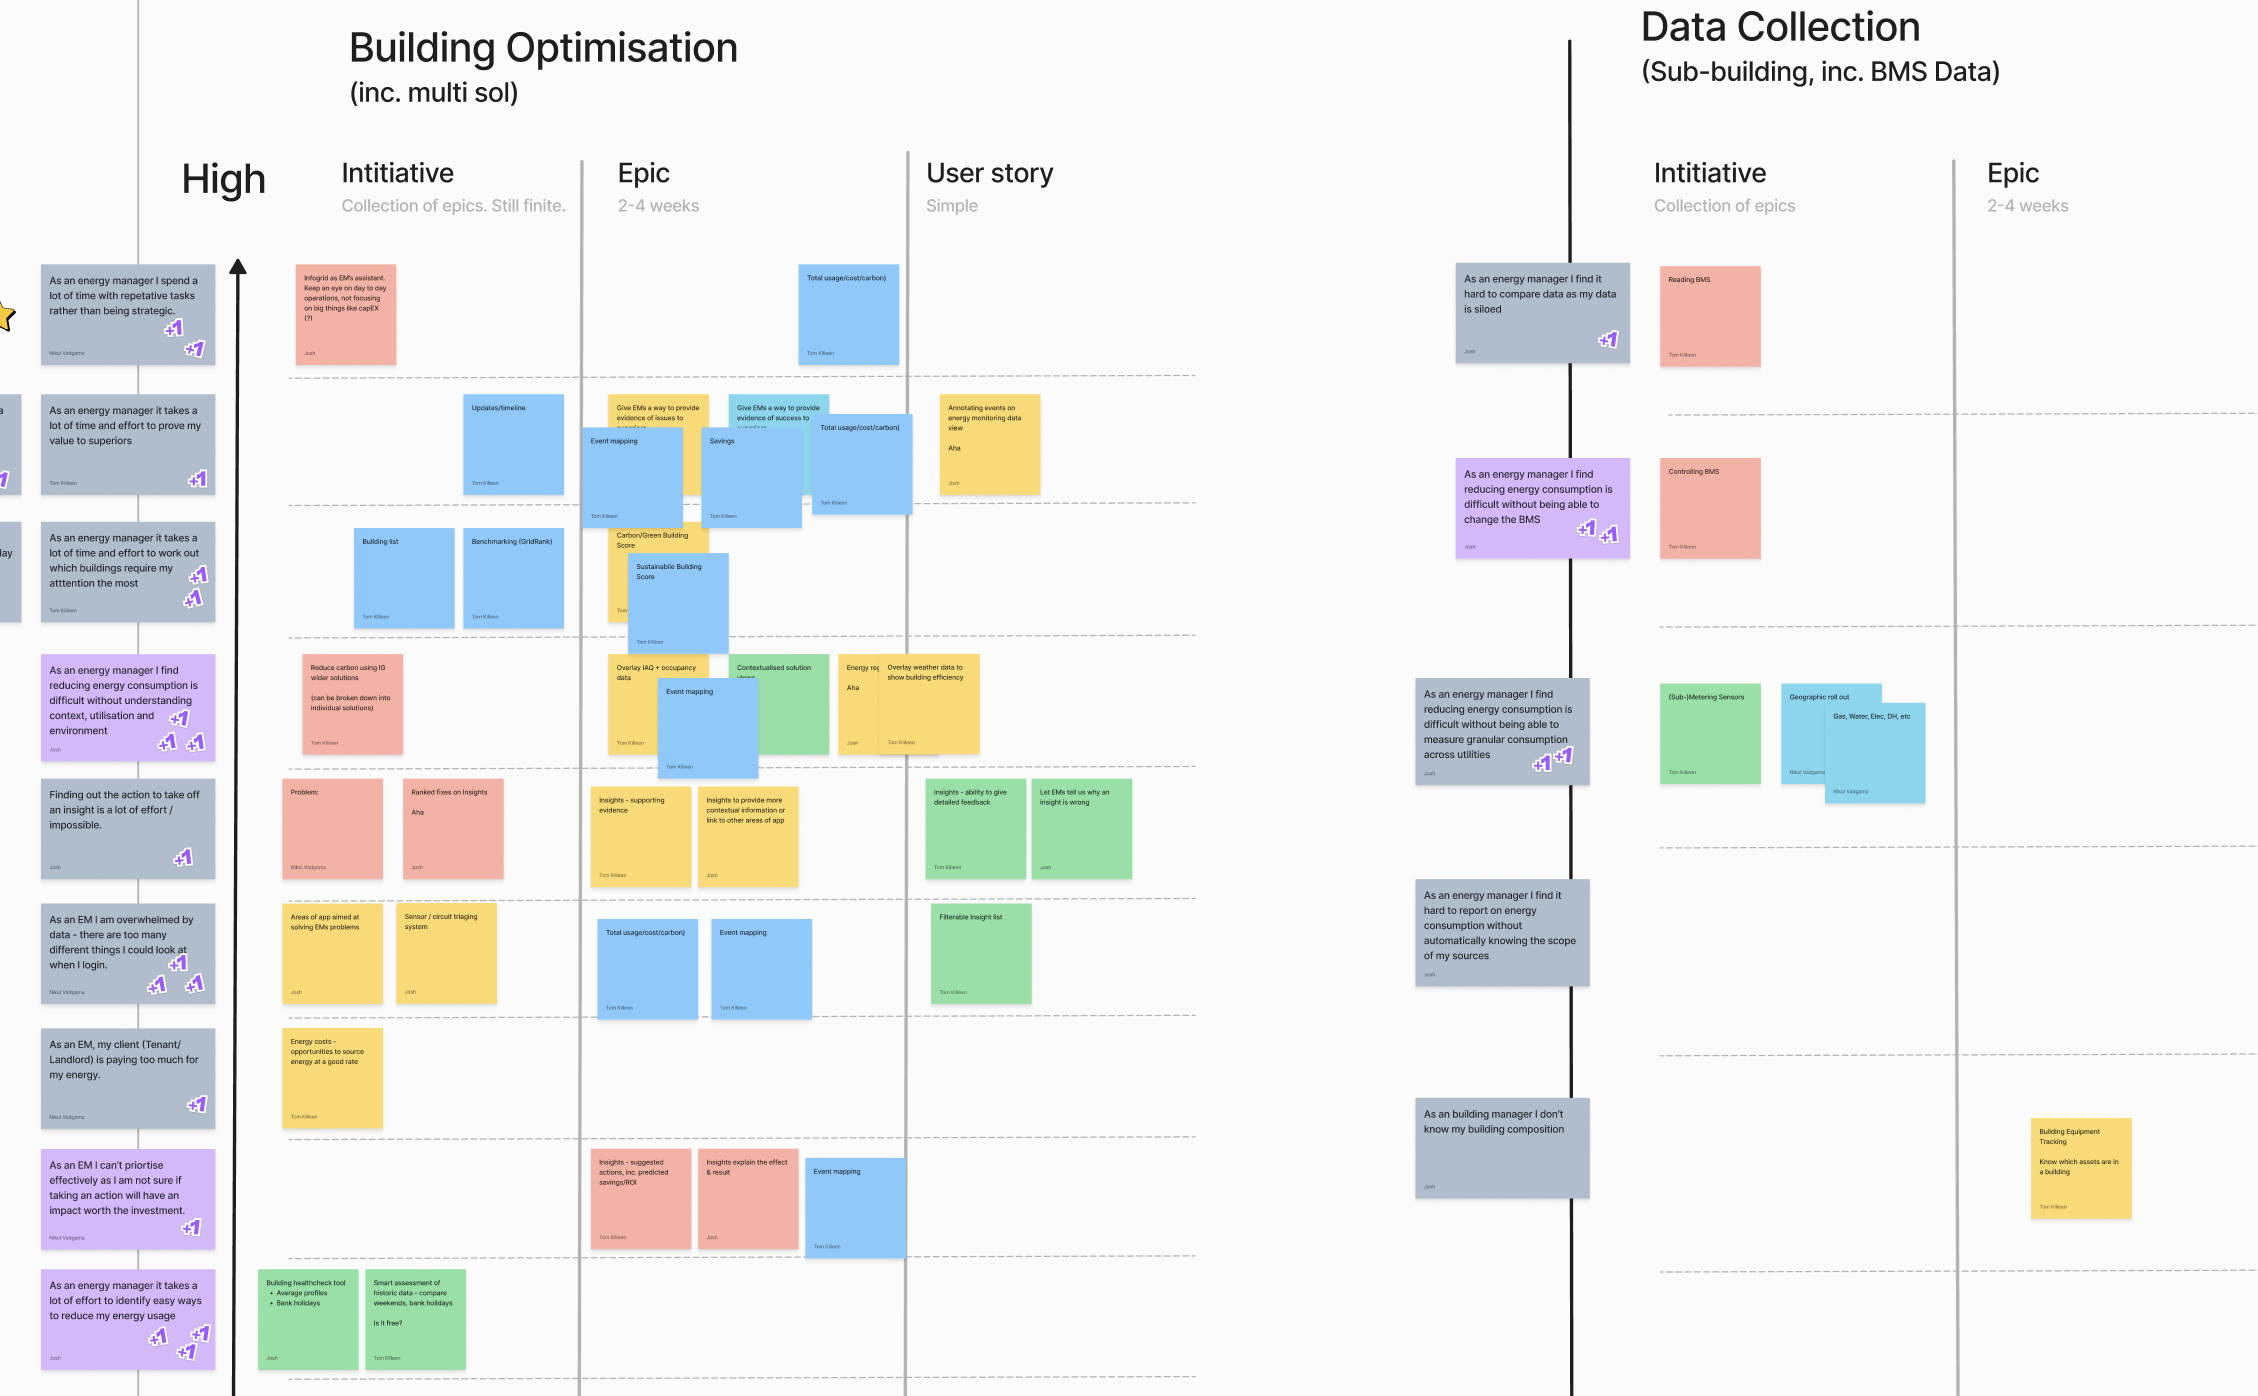
Prioritisation workshop
Exploring Solutions
Multiple Explorations
Because we weren't certain which problem statement would yield the highest impact, I worked on parallel solutions simultaneously using brainstorming, wireframing, and experience principle generation.
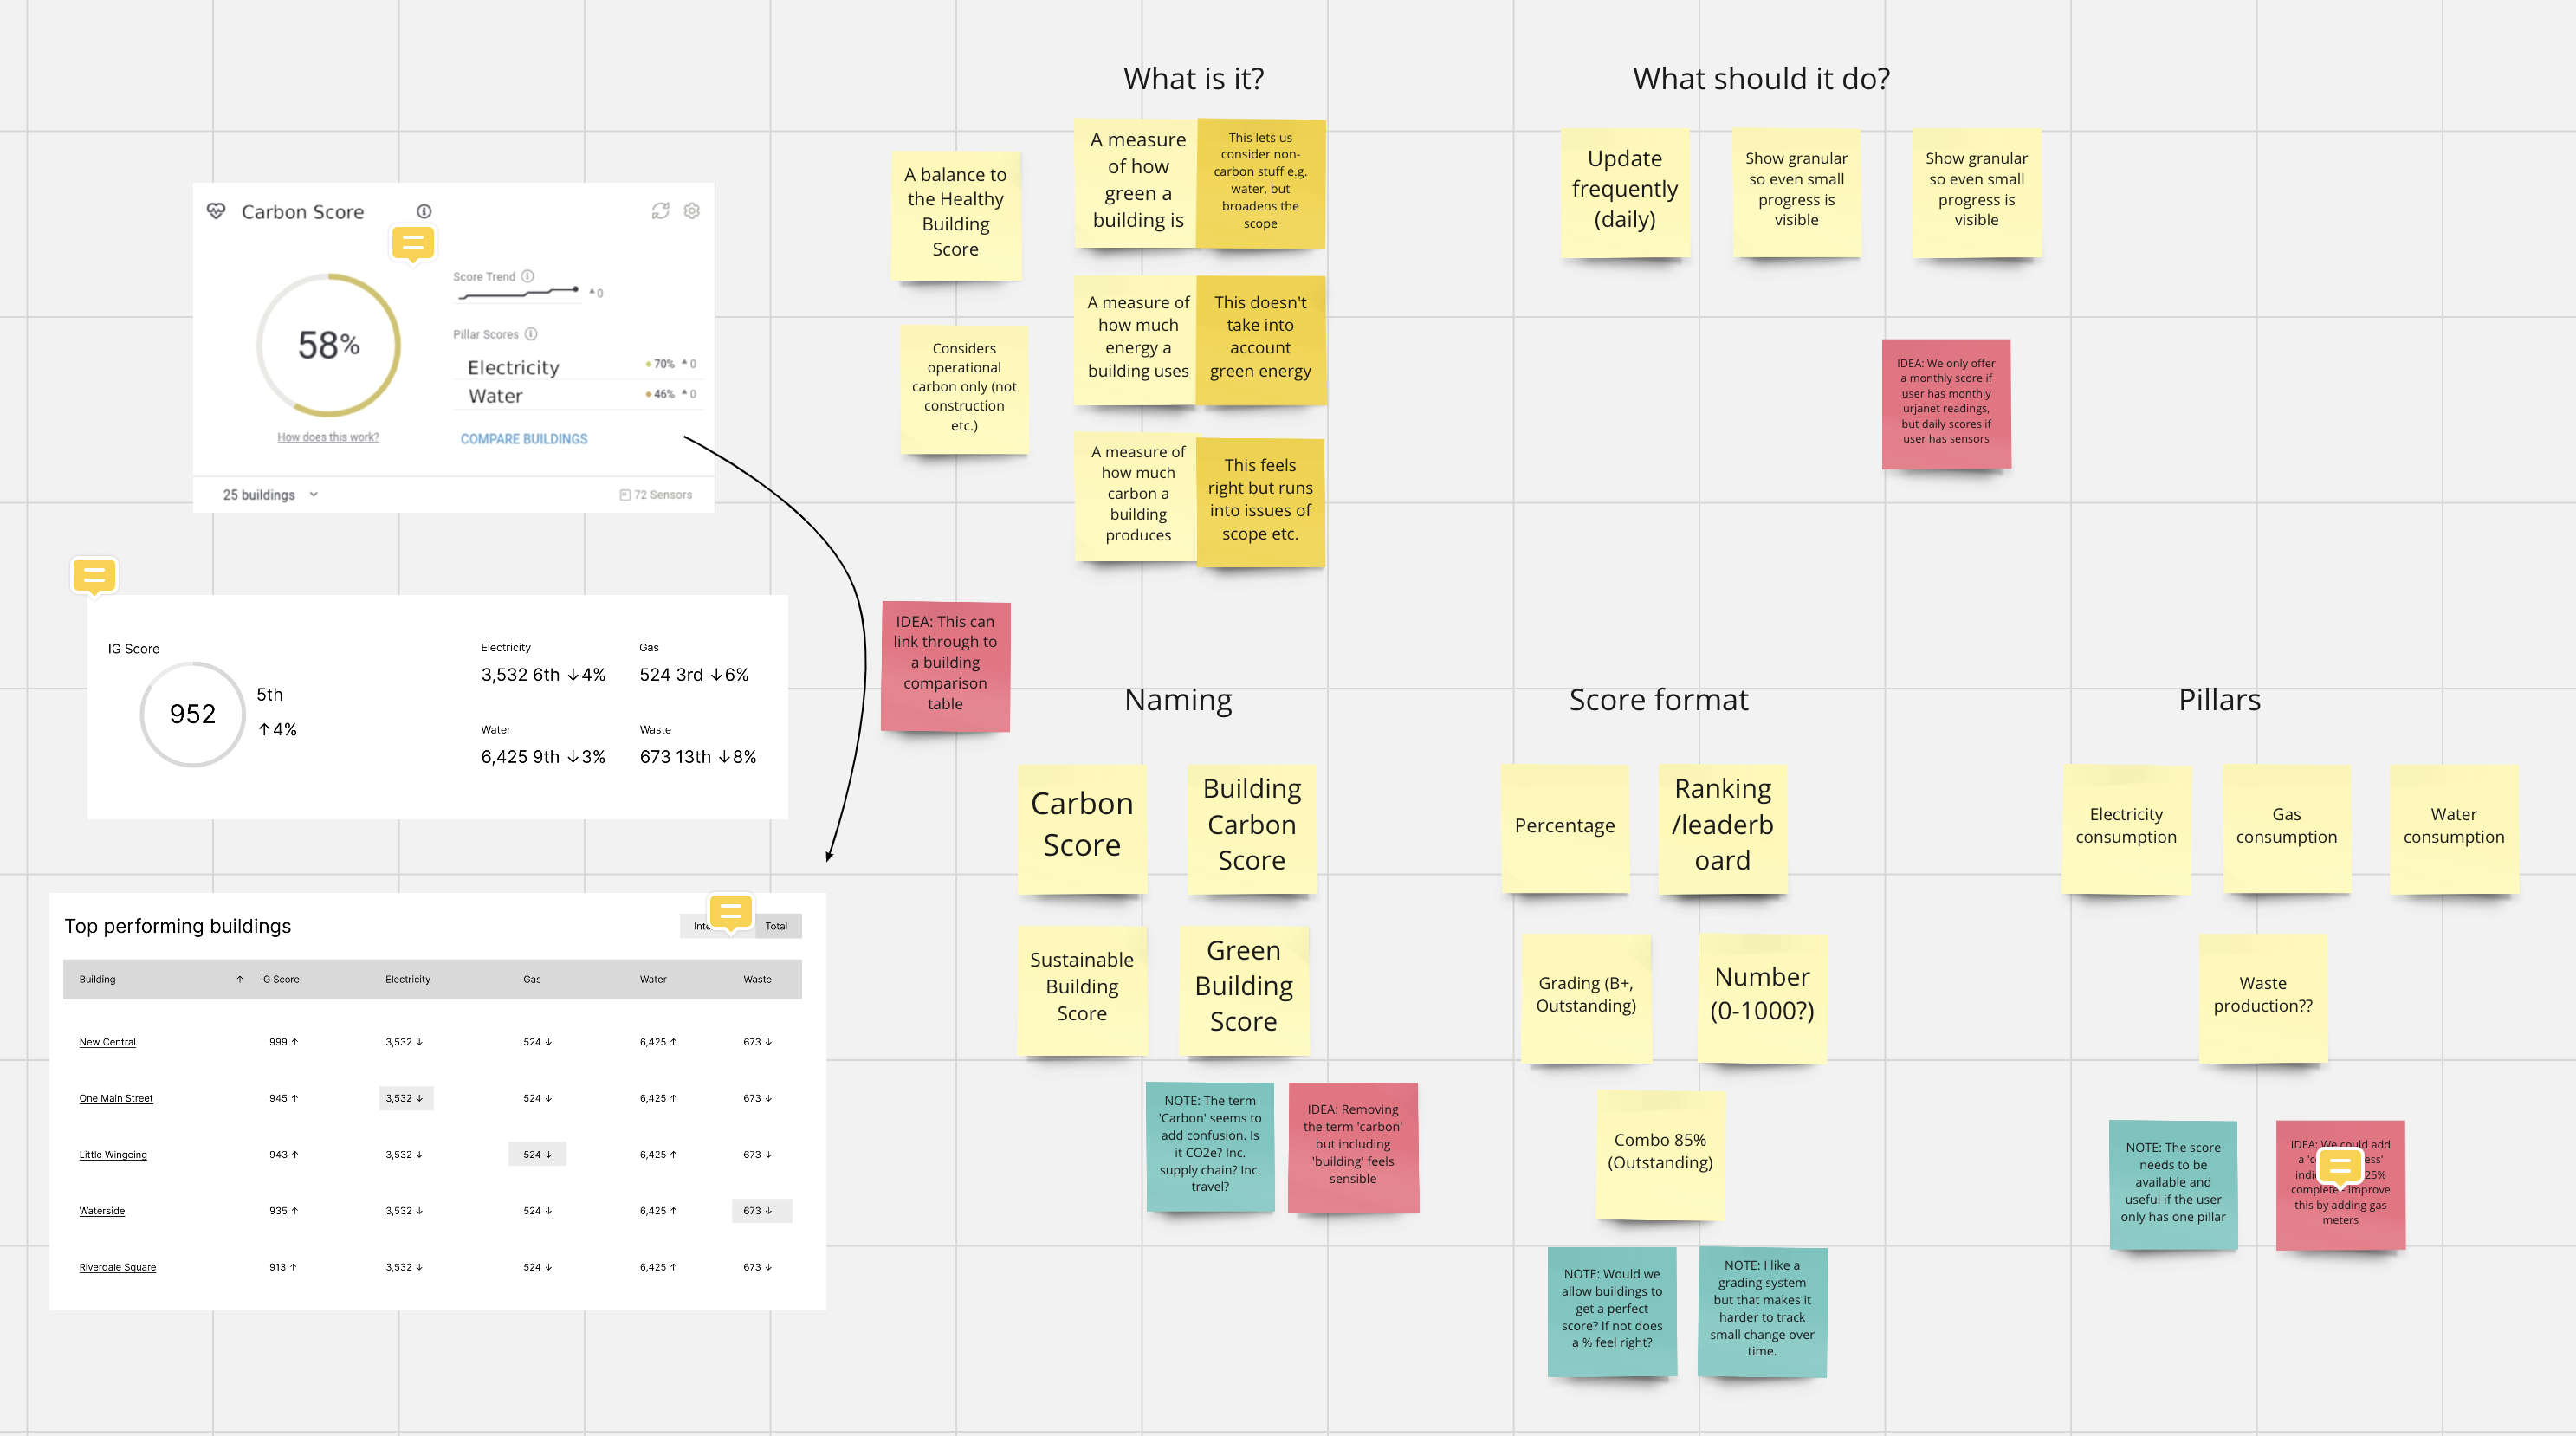
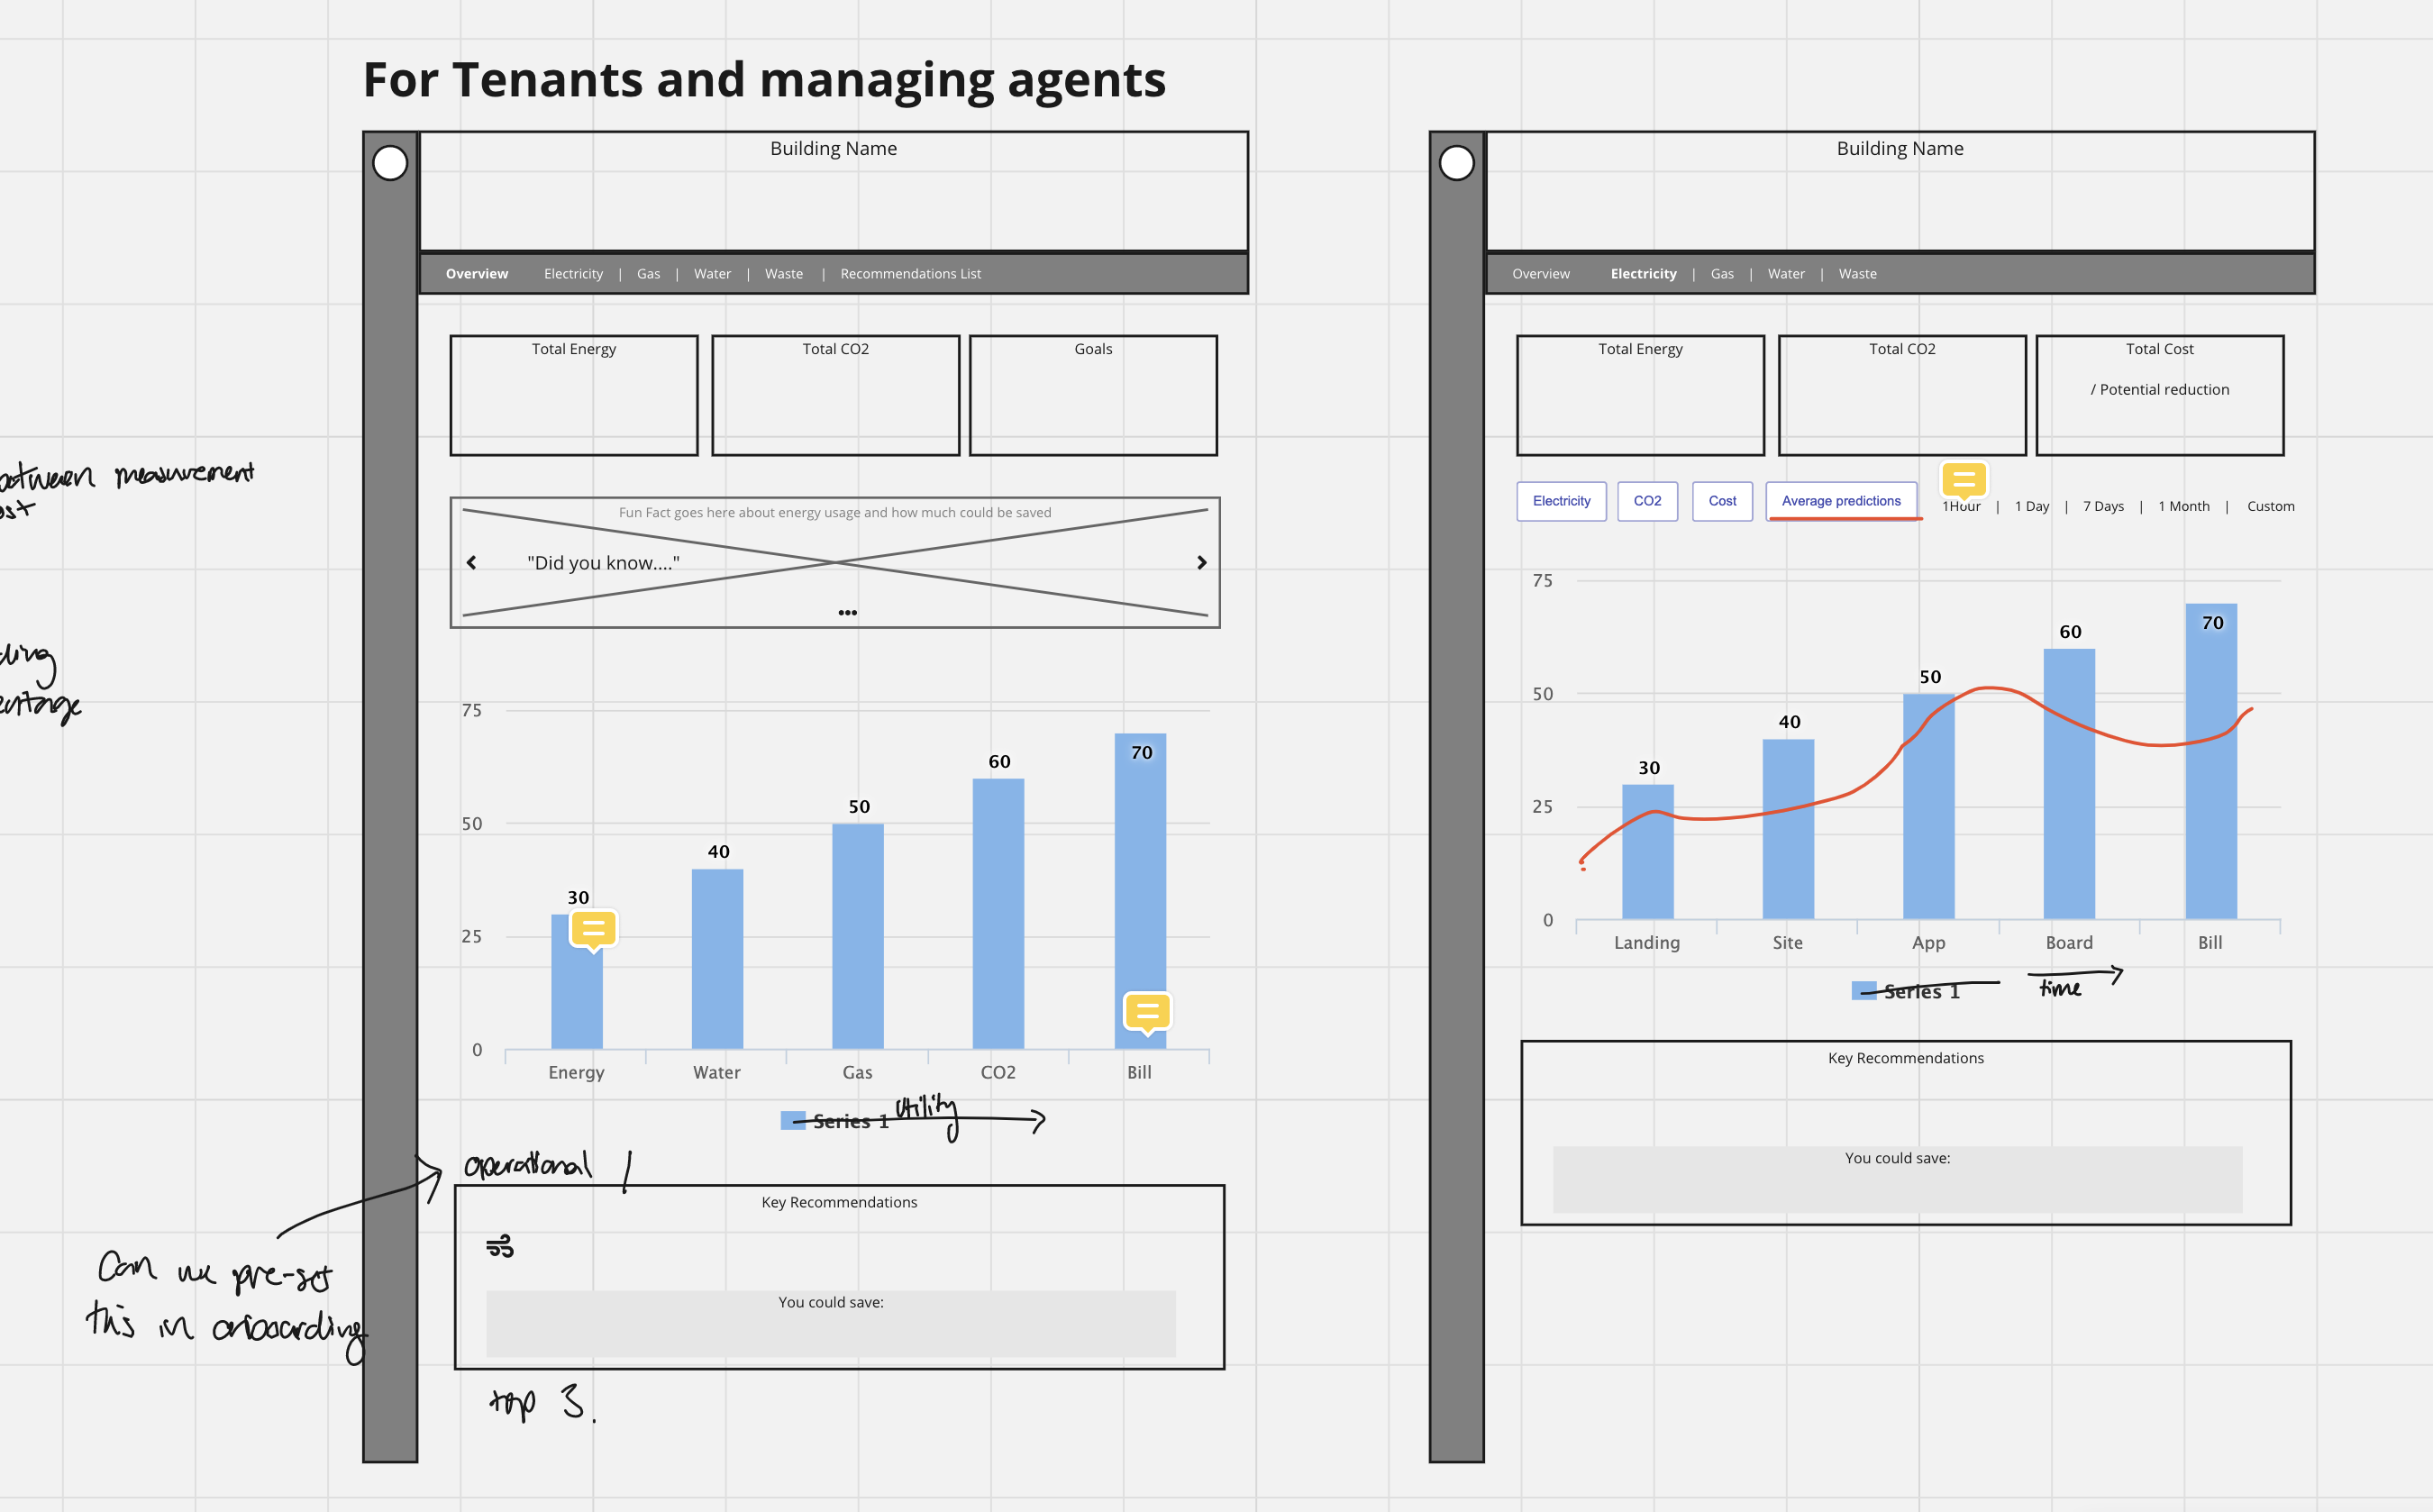
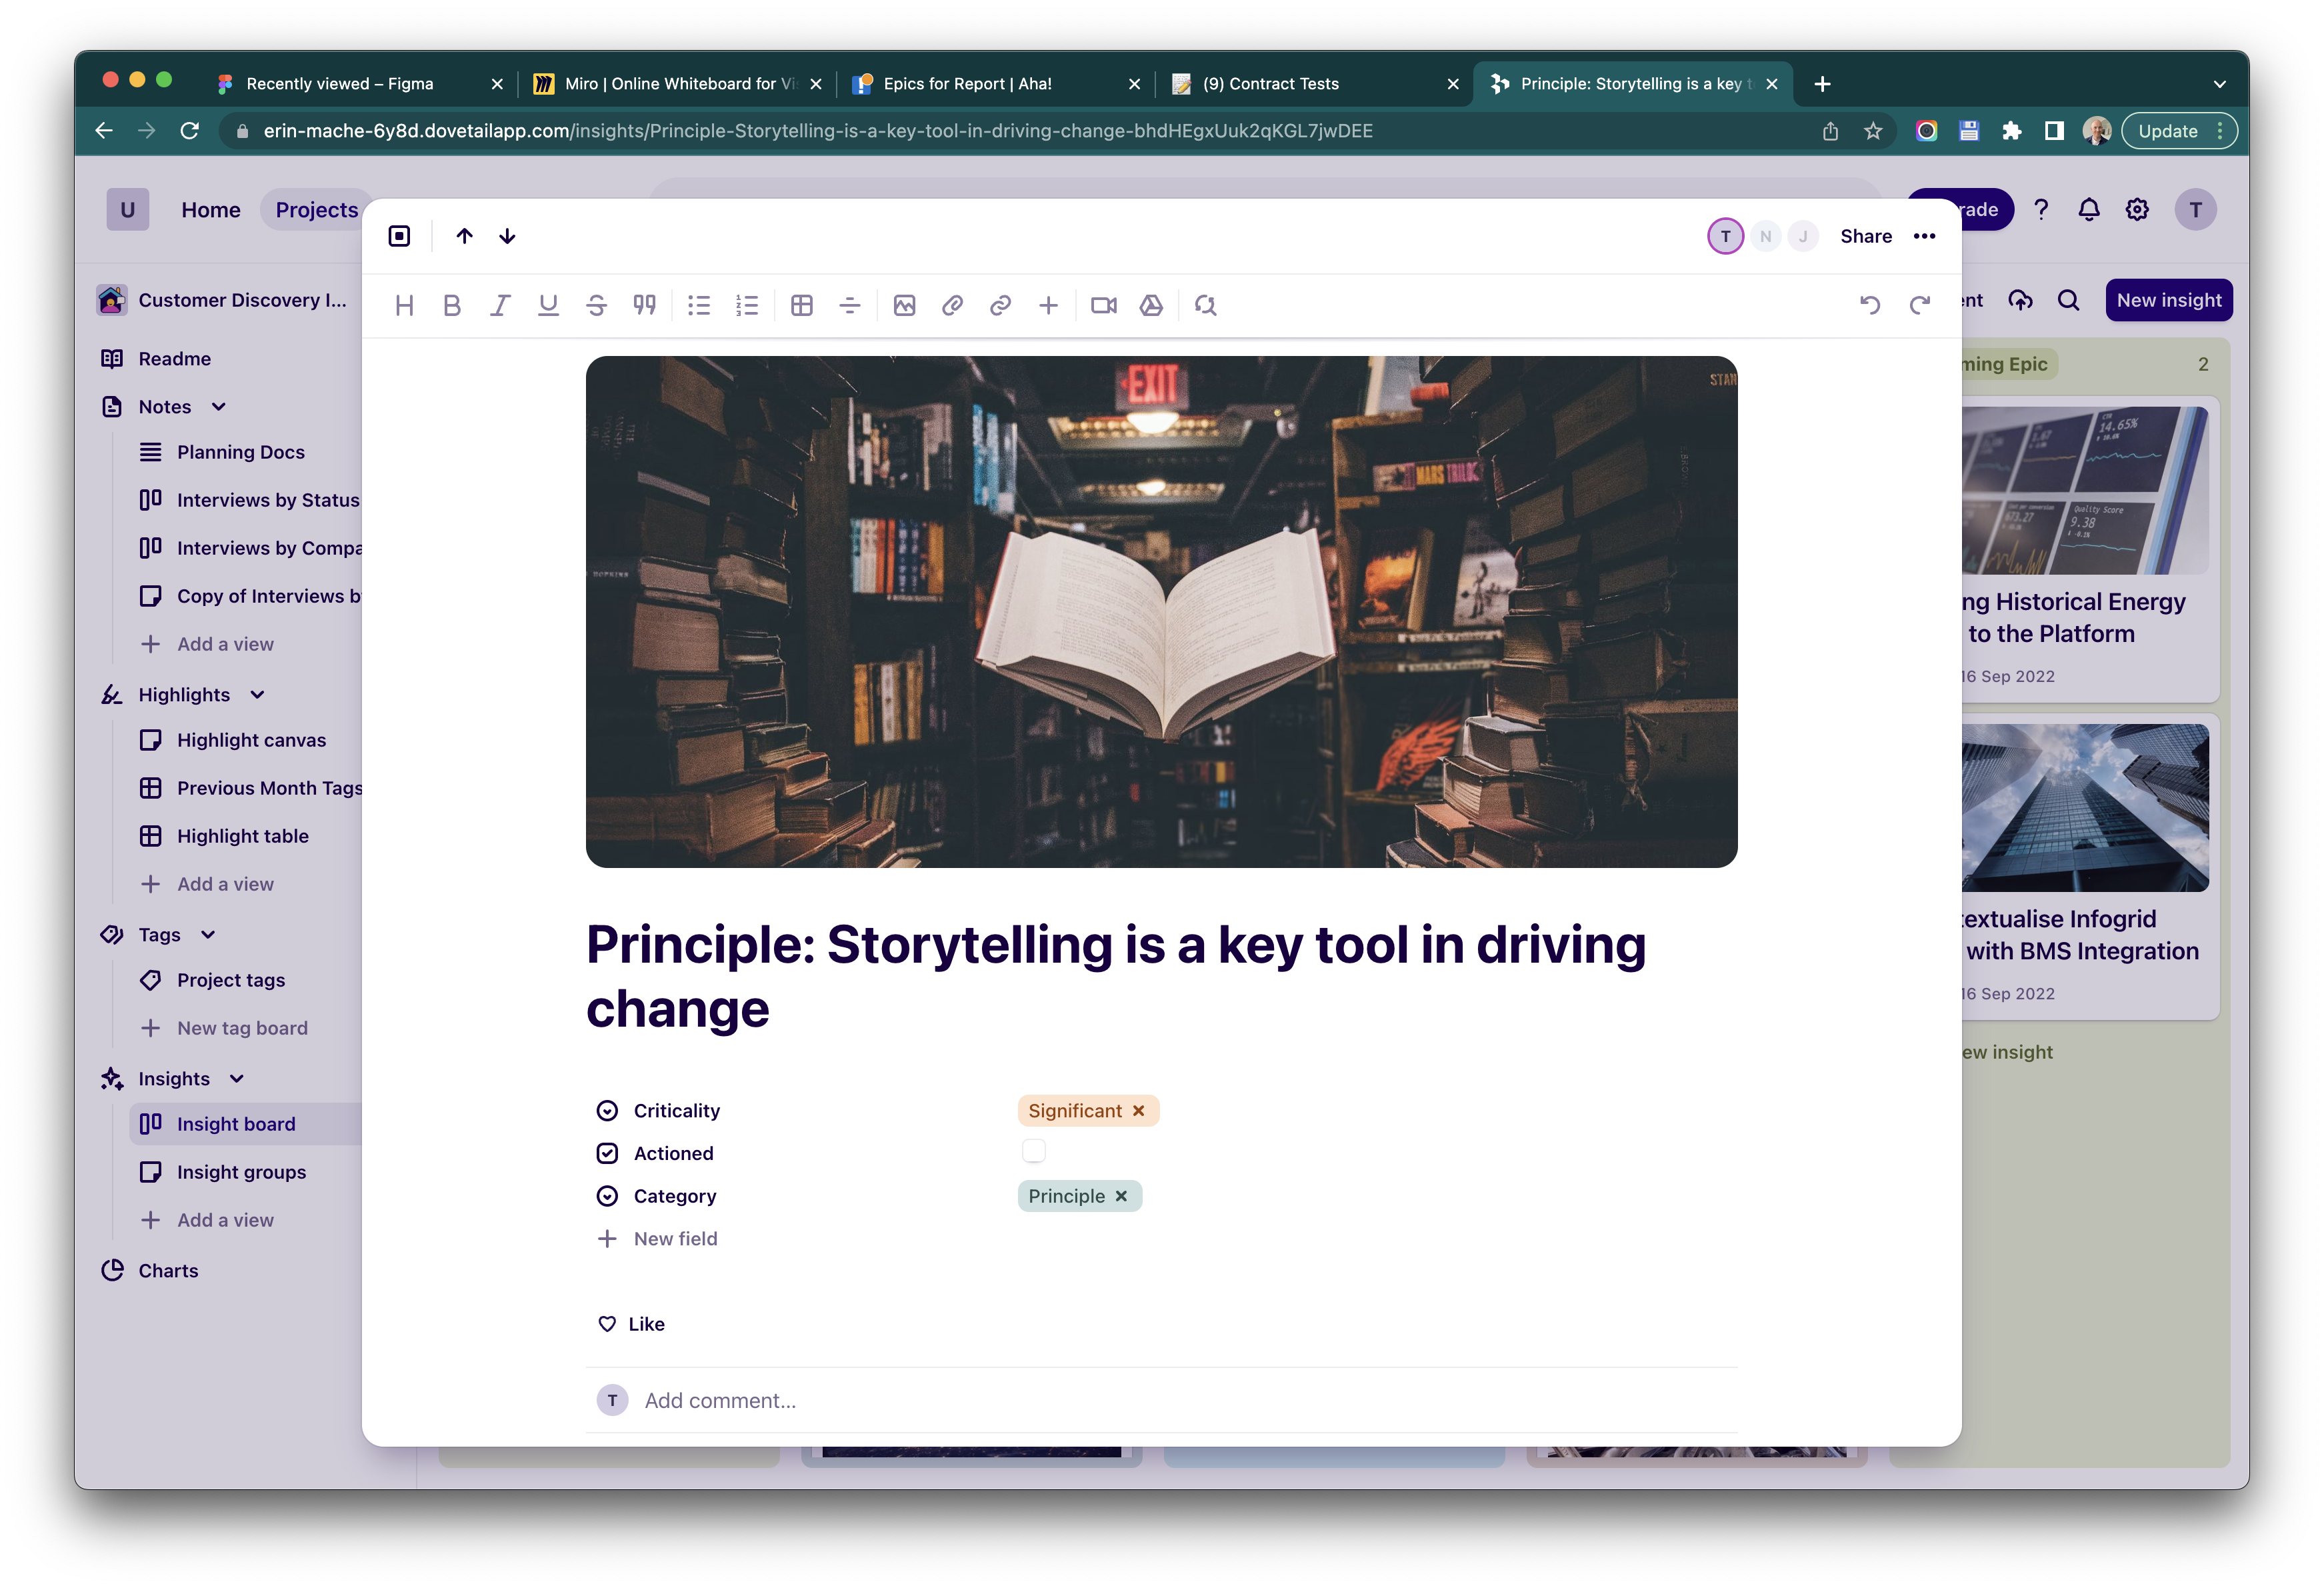
Various ideation methods: brainstorming, wireframing, experience principle generation
Prototyping
I built low and high-fidelity Figma prototypes to test solution desirability, comprehension, and usability with customers, while aligning with engineering and commercial teams on feasibility and viability.
Low fidelity Figma prototype
High fidelity ProtoPie prototype
Concept Validation
I used the prototype to aid discussions with the engineering and commercial teams about the feasibility and viability of the proposed solutions.
I also worked with the Product Manager to set up a series of interviews with customers. I used the interviews to gauge the desirability of the proposed solutions and also the comprehension and usability of the execution.
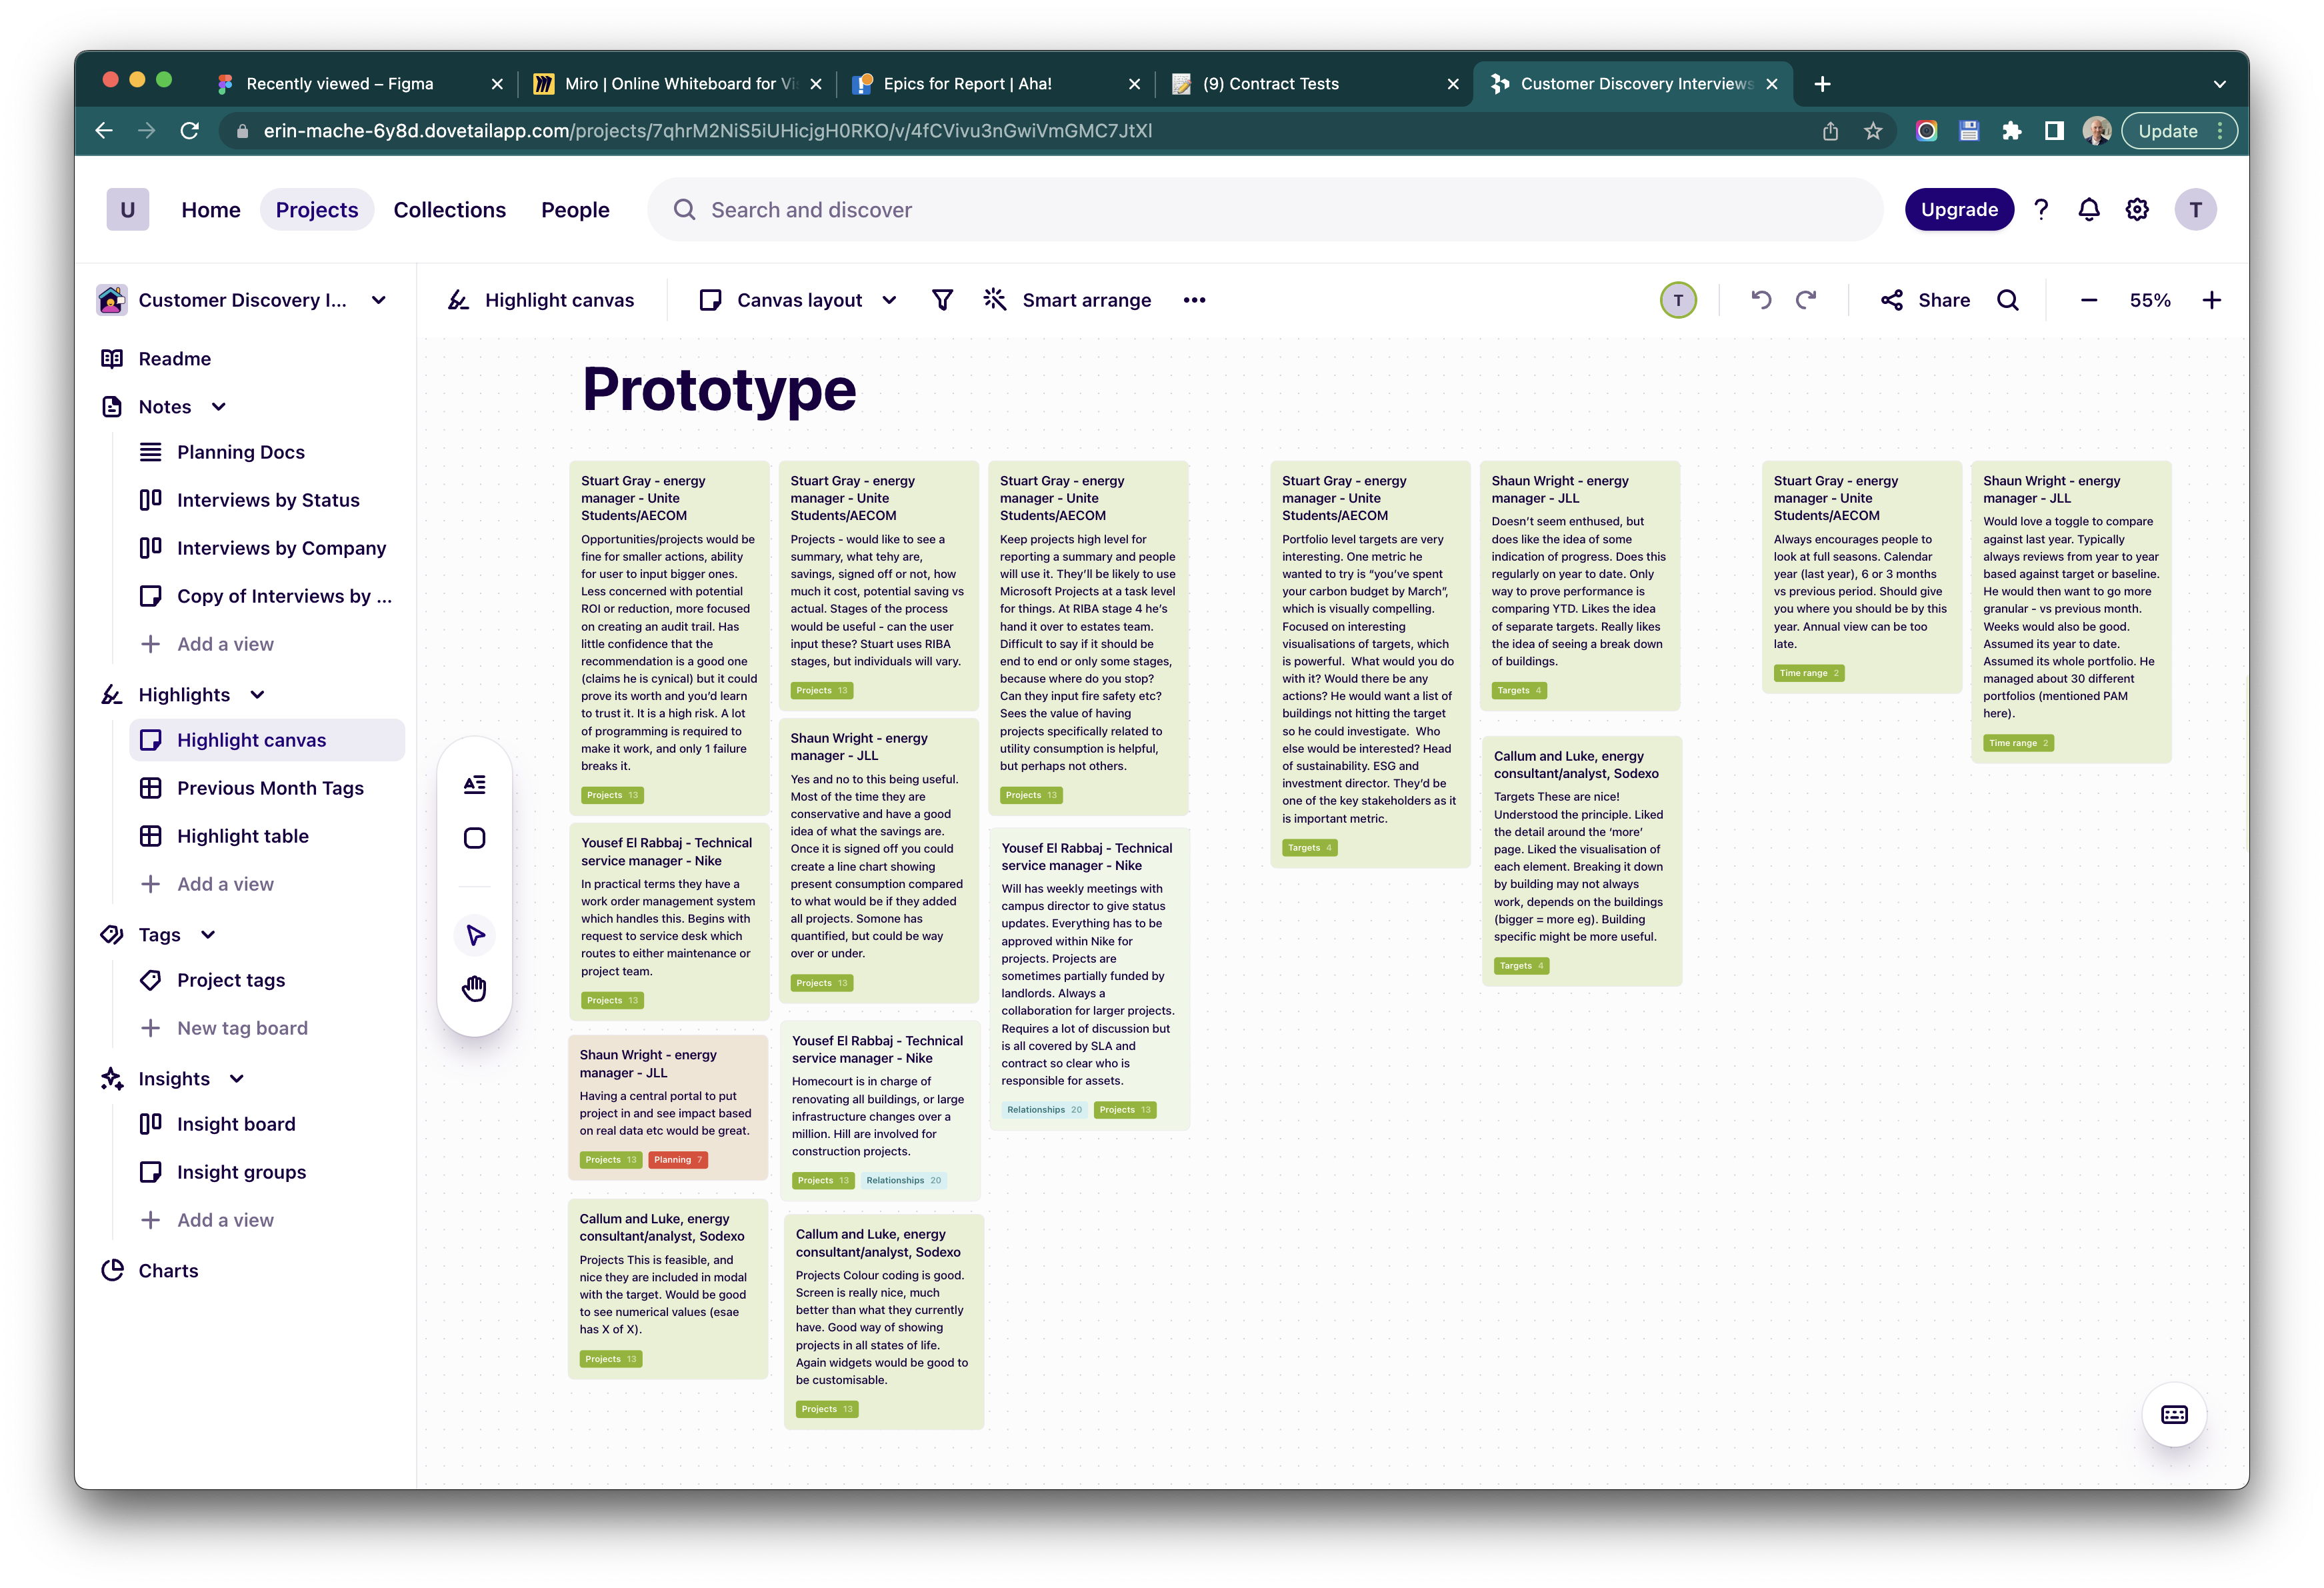
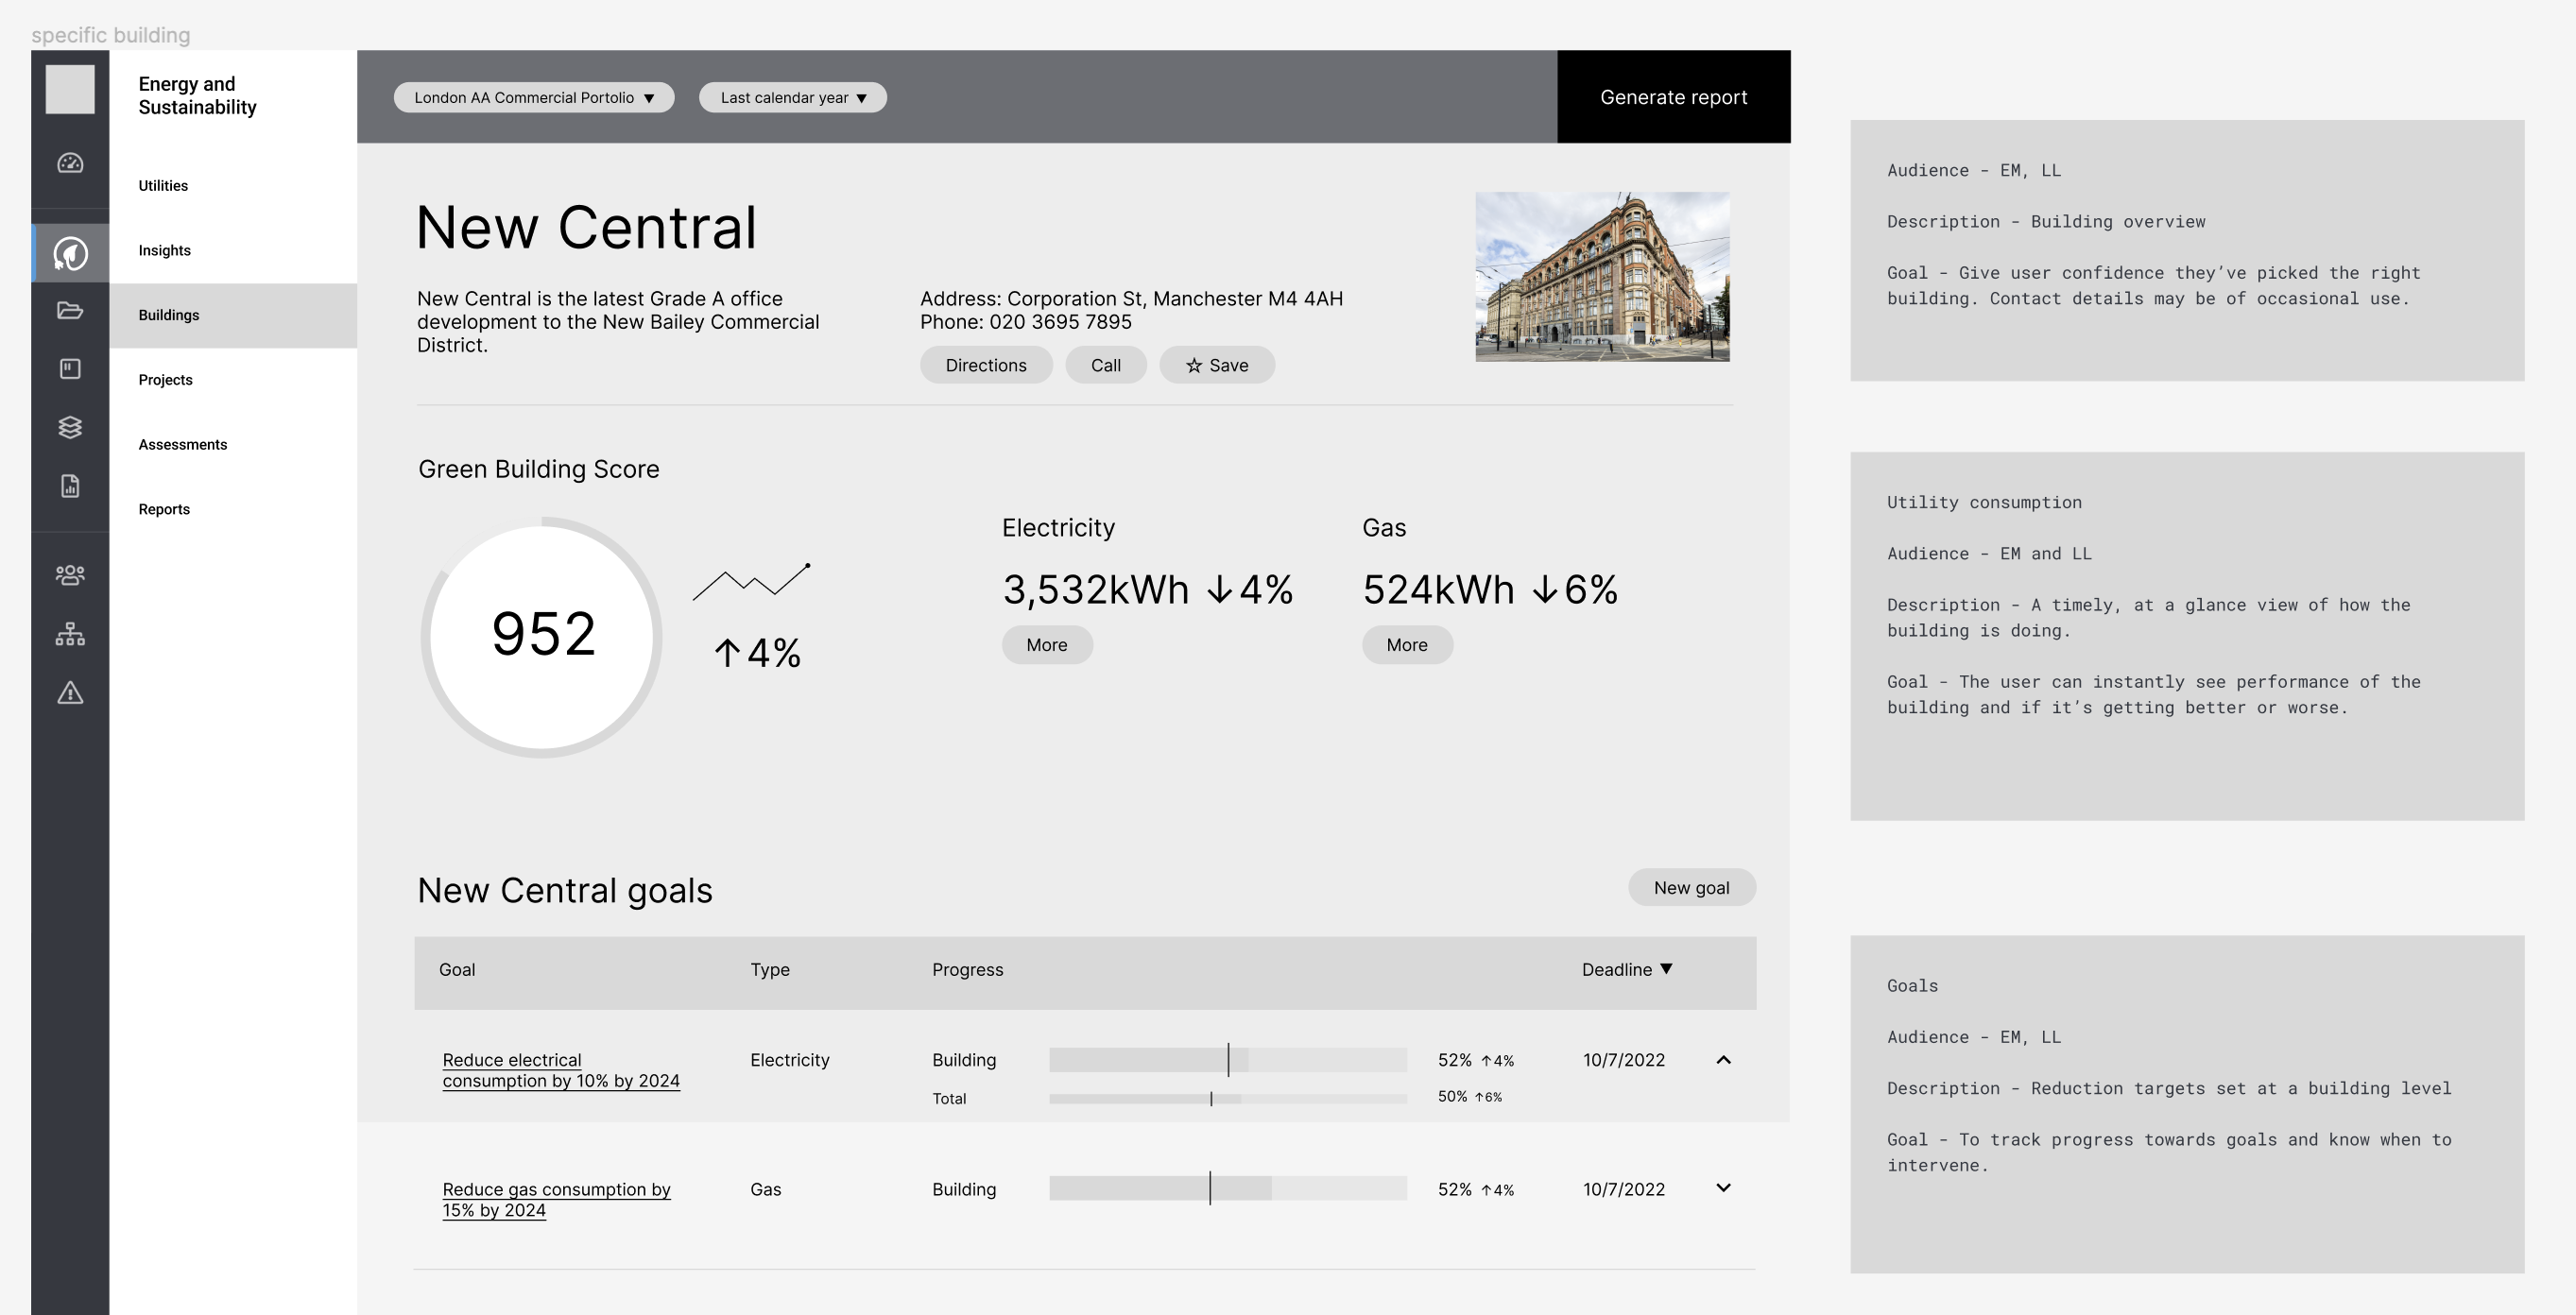
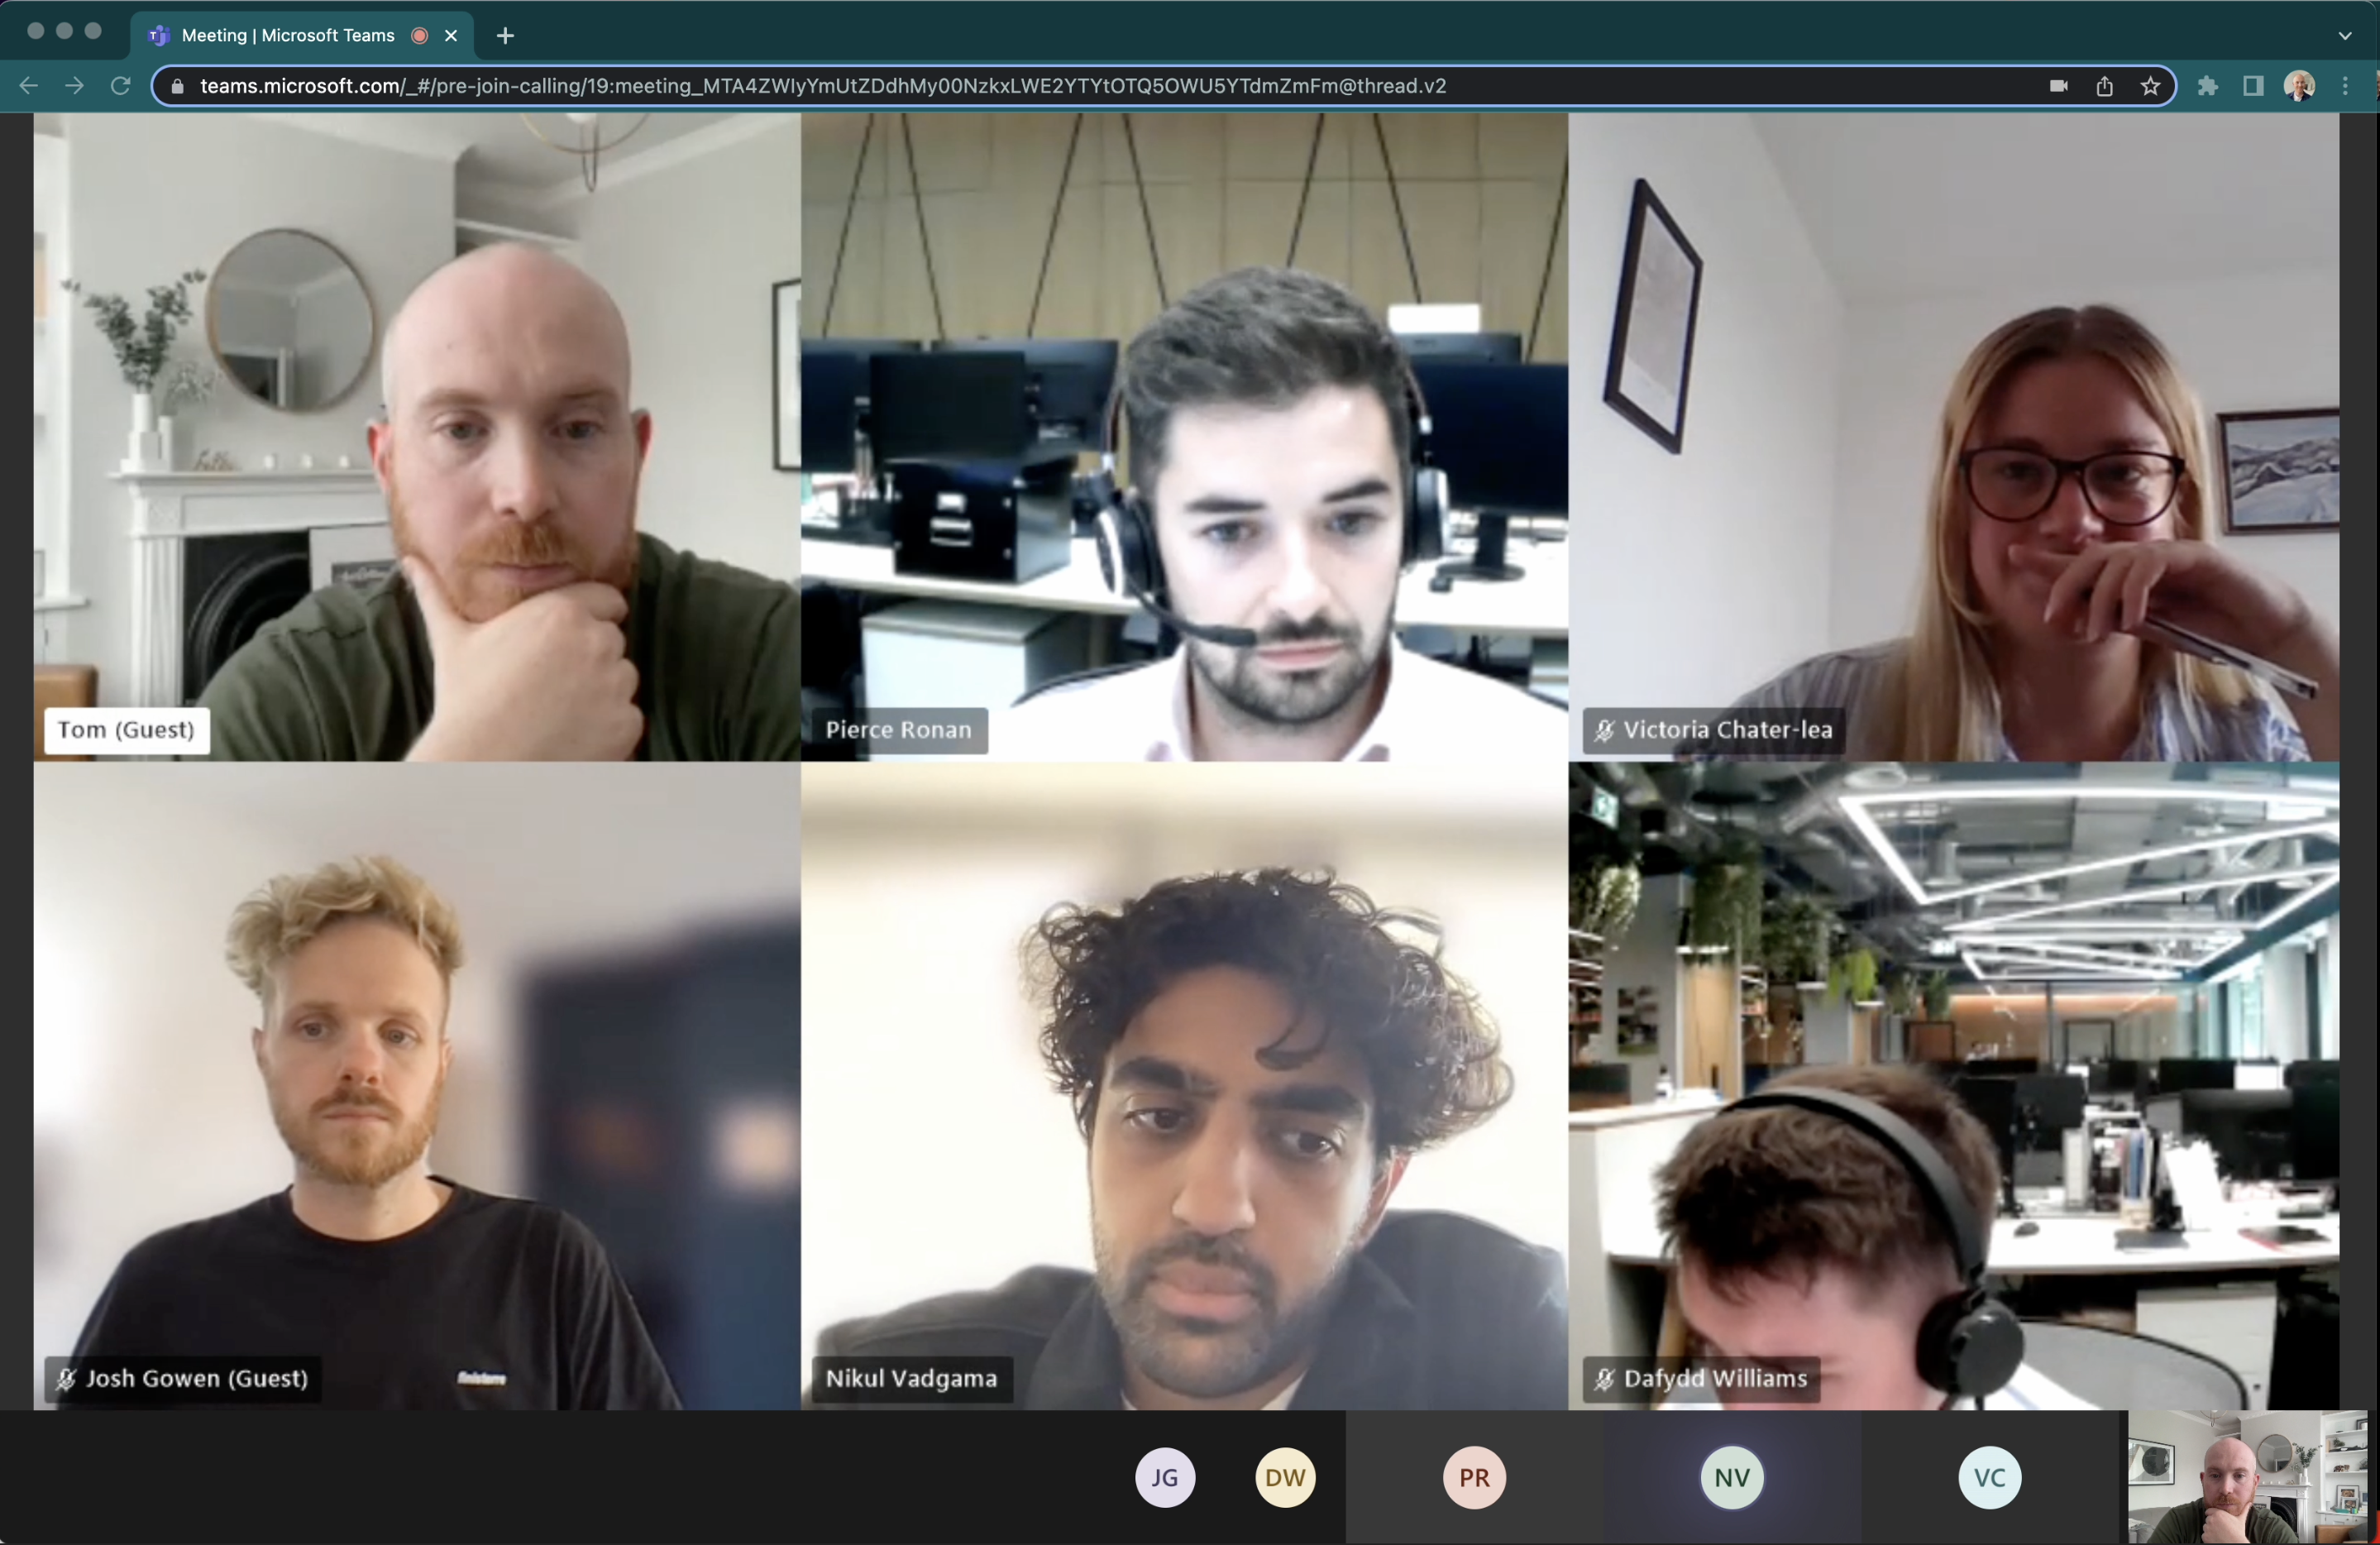
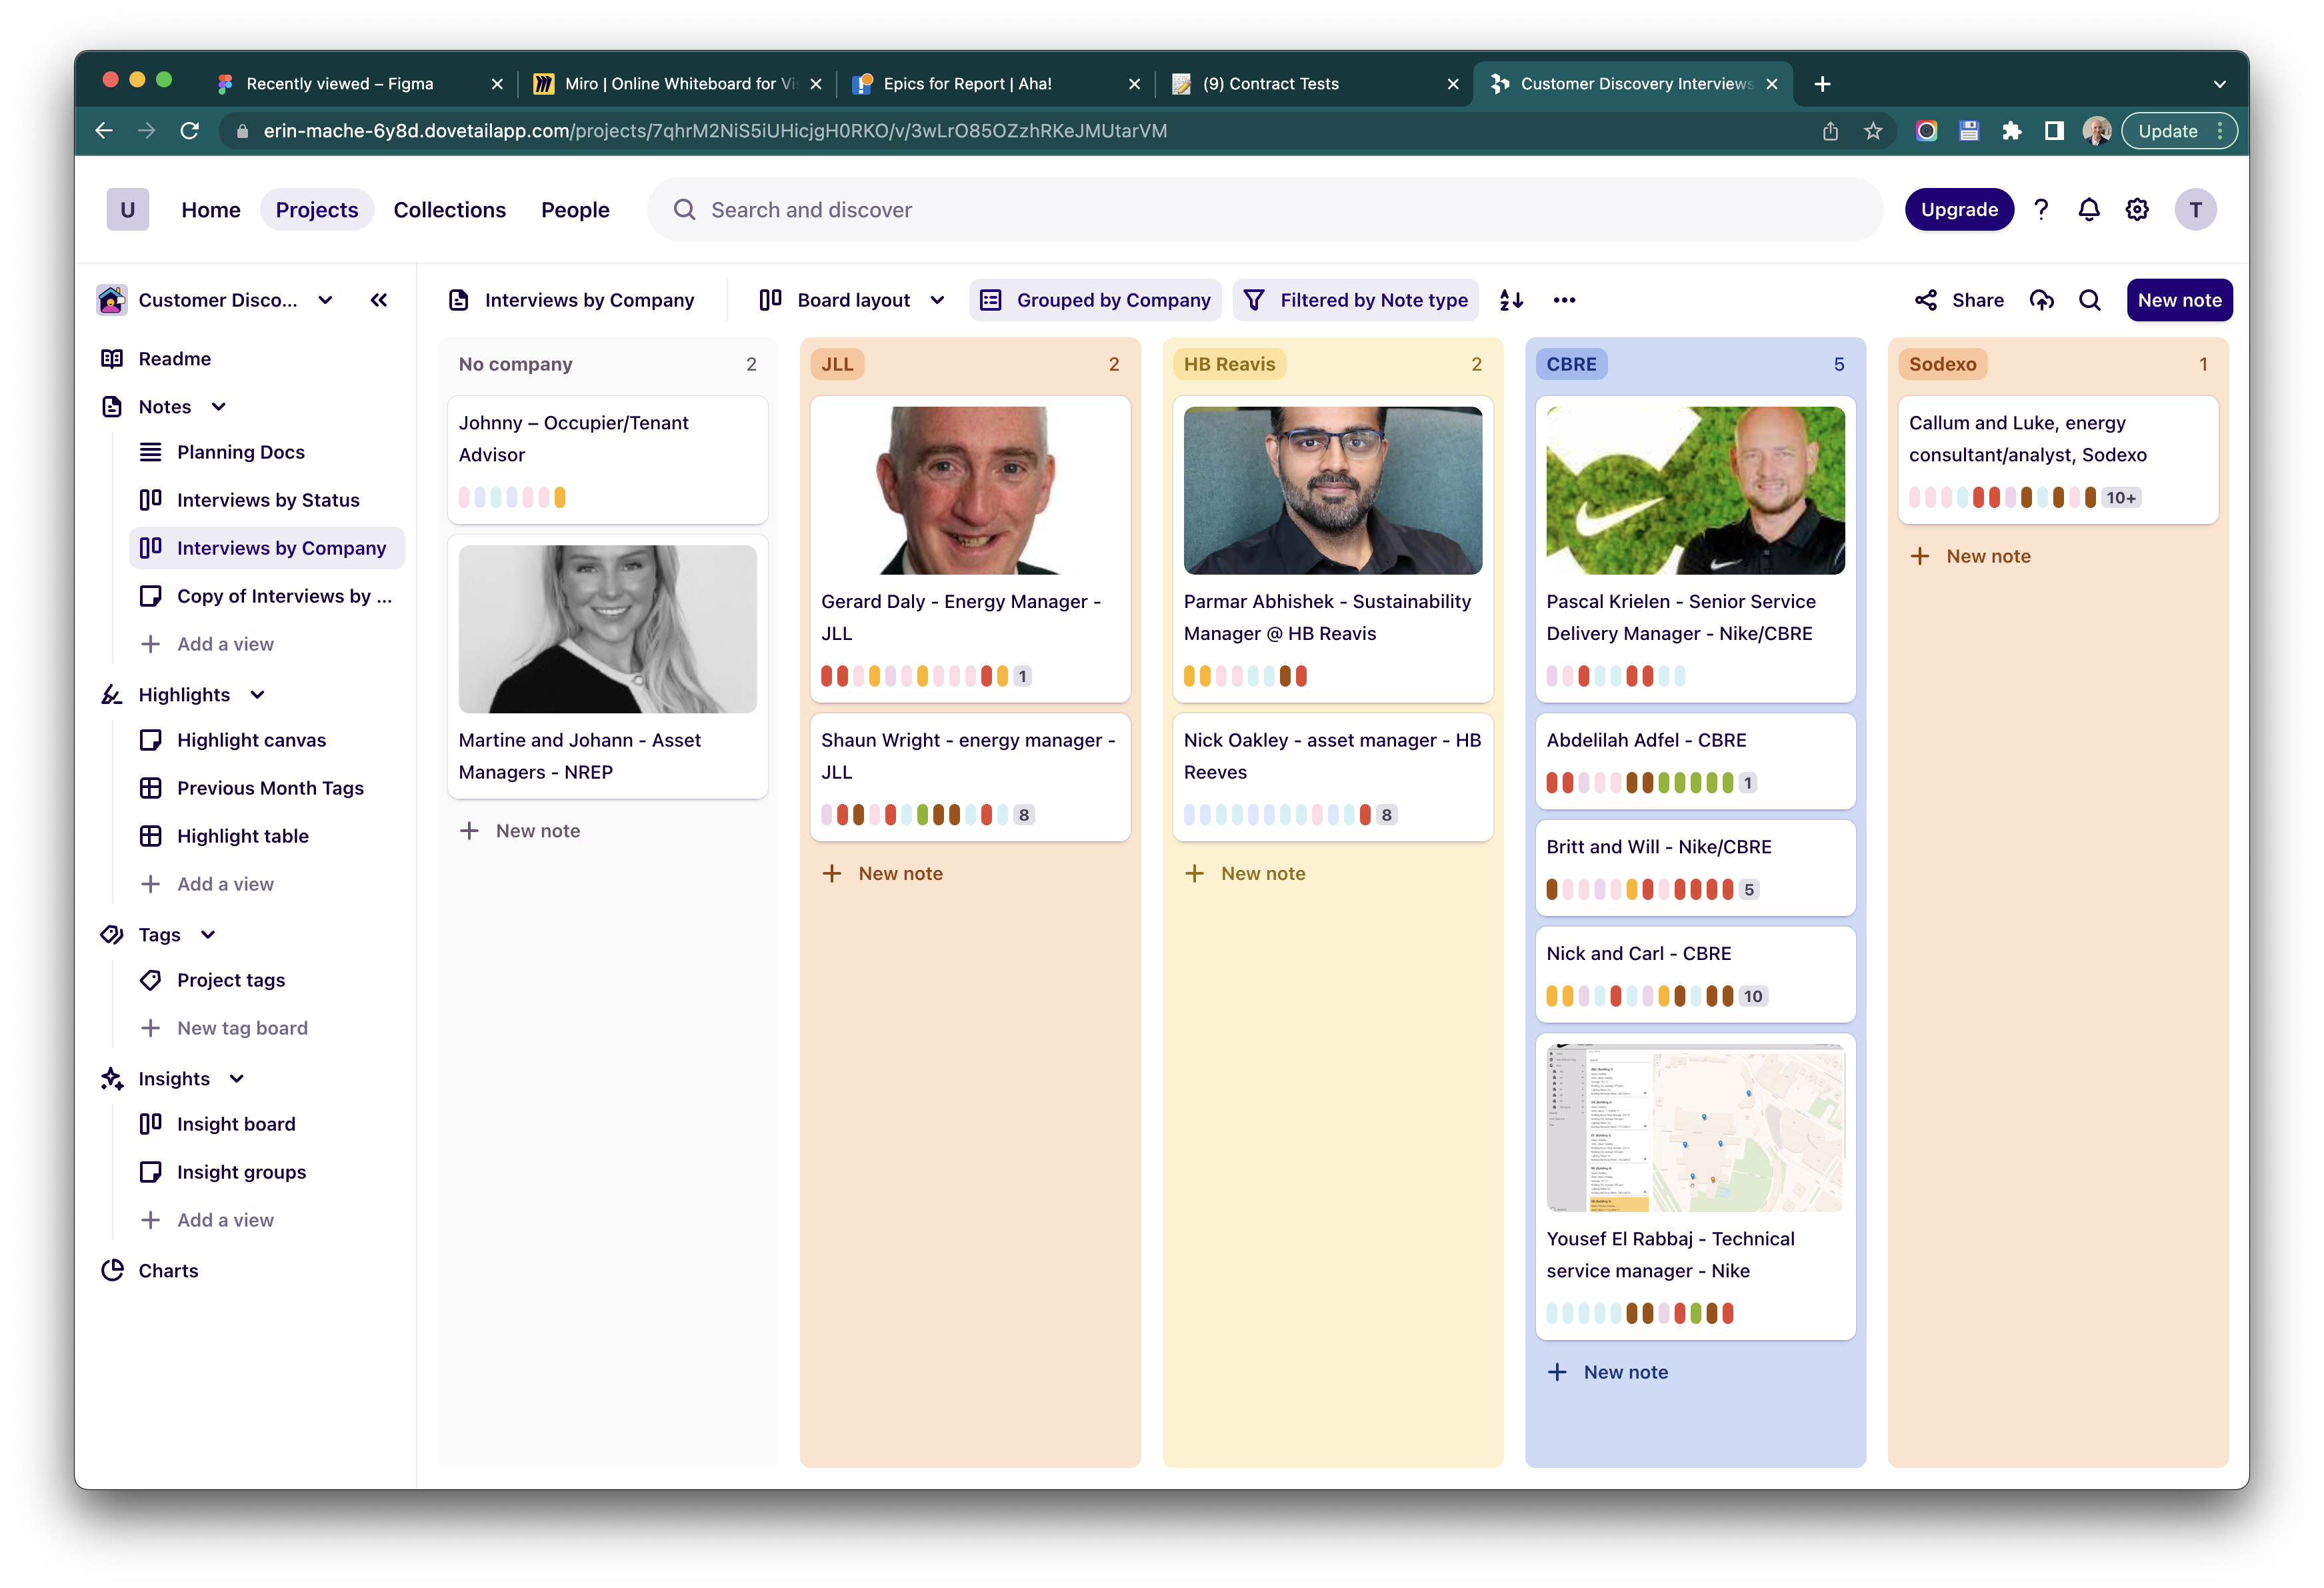
Testing solutions with customers using a Figma prototype and logging findings in Dovetail
Solution
Planning
Using the insights from the customer interviews, I worked with the team discipline leads to prioritise solutions.
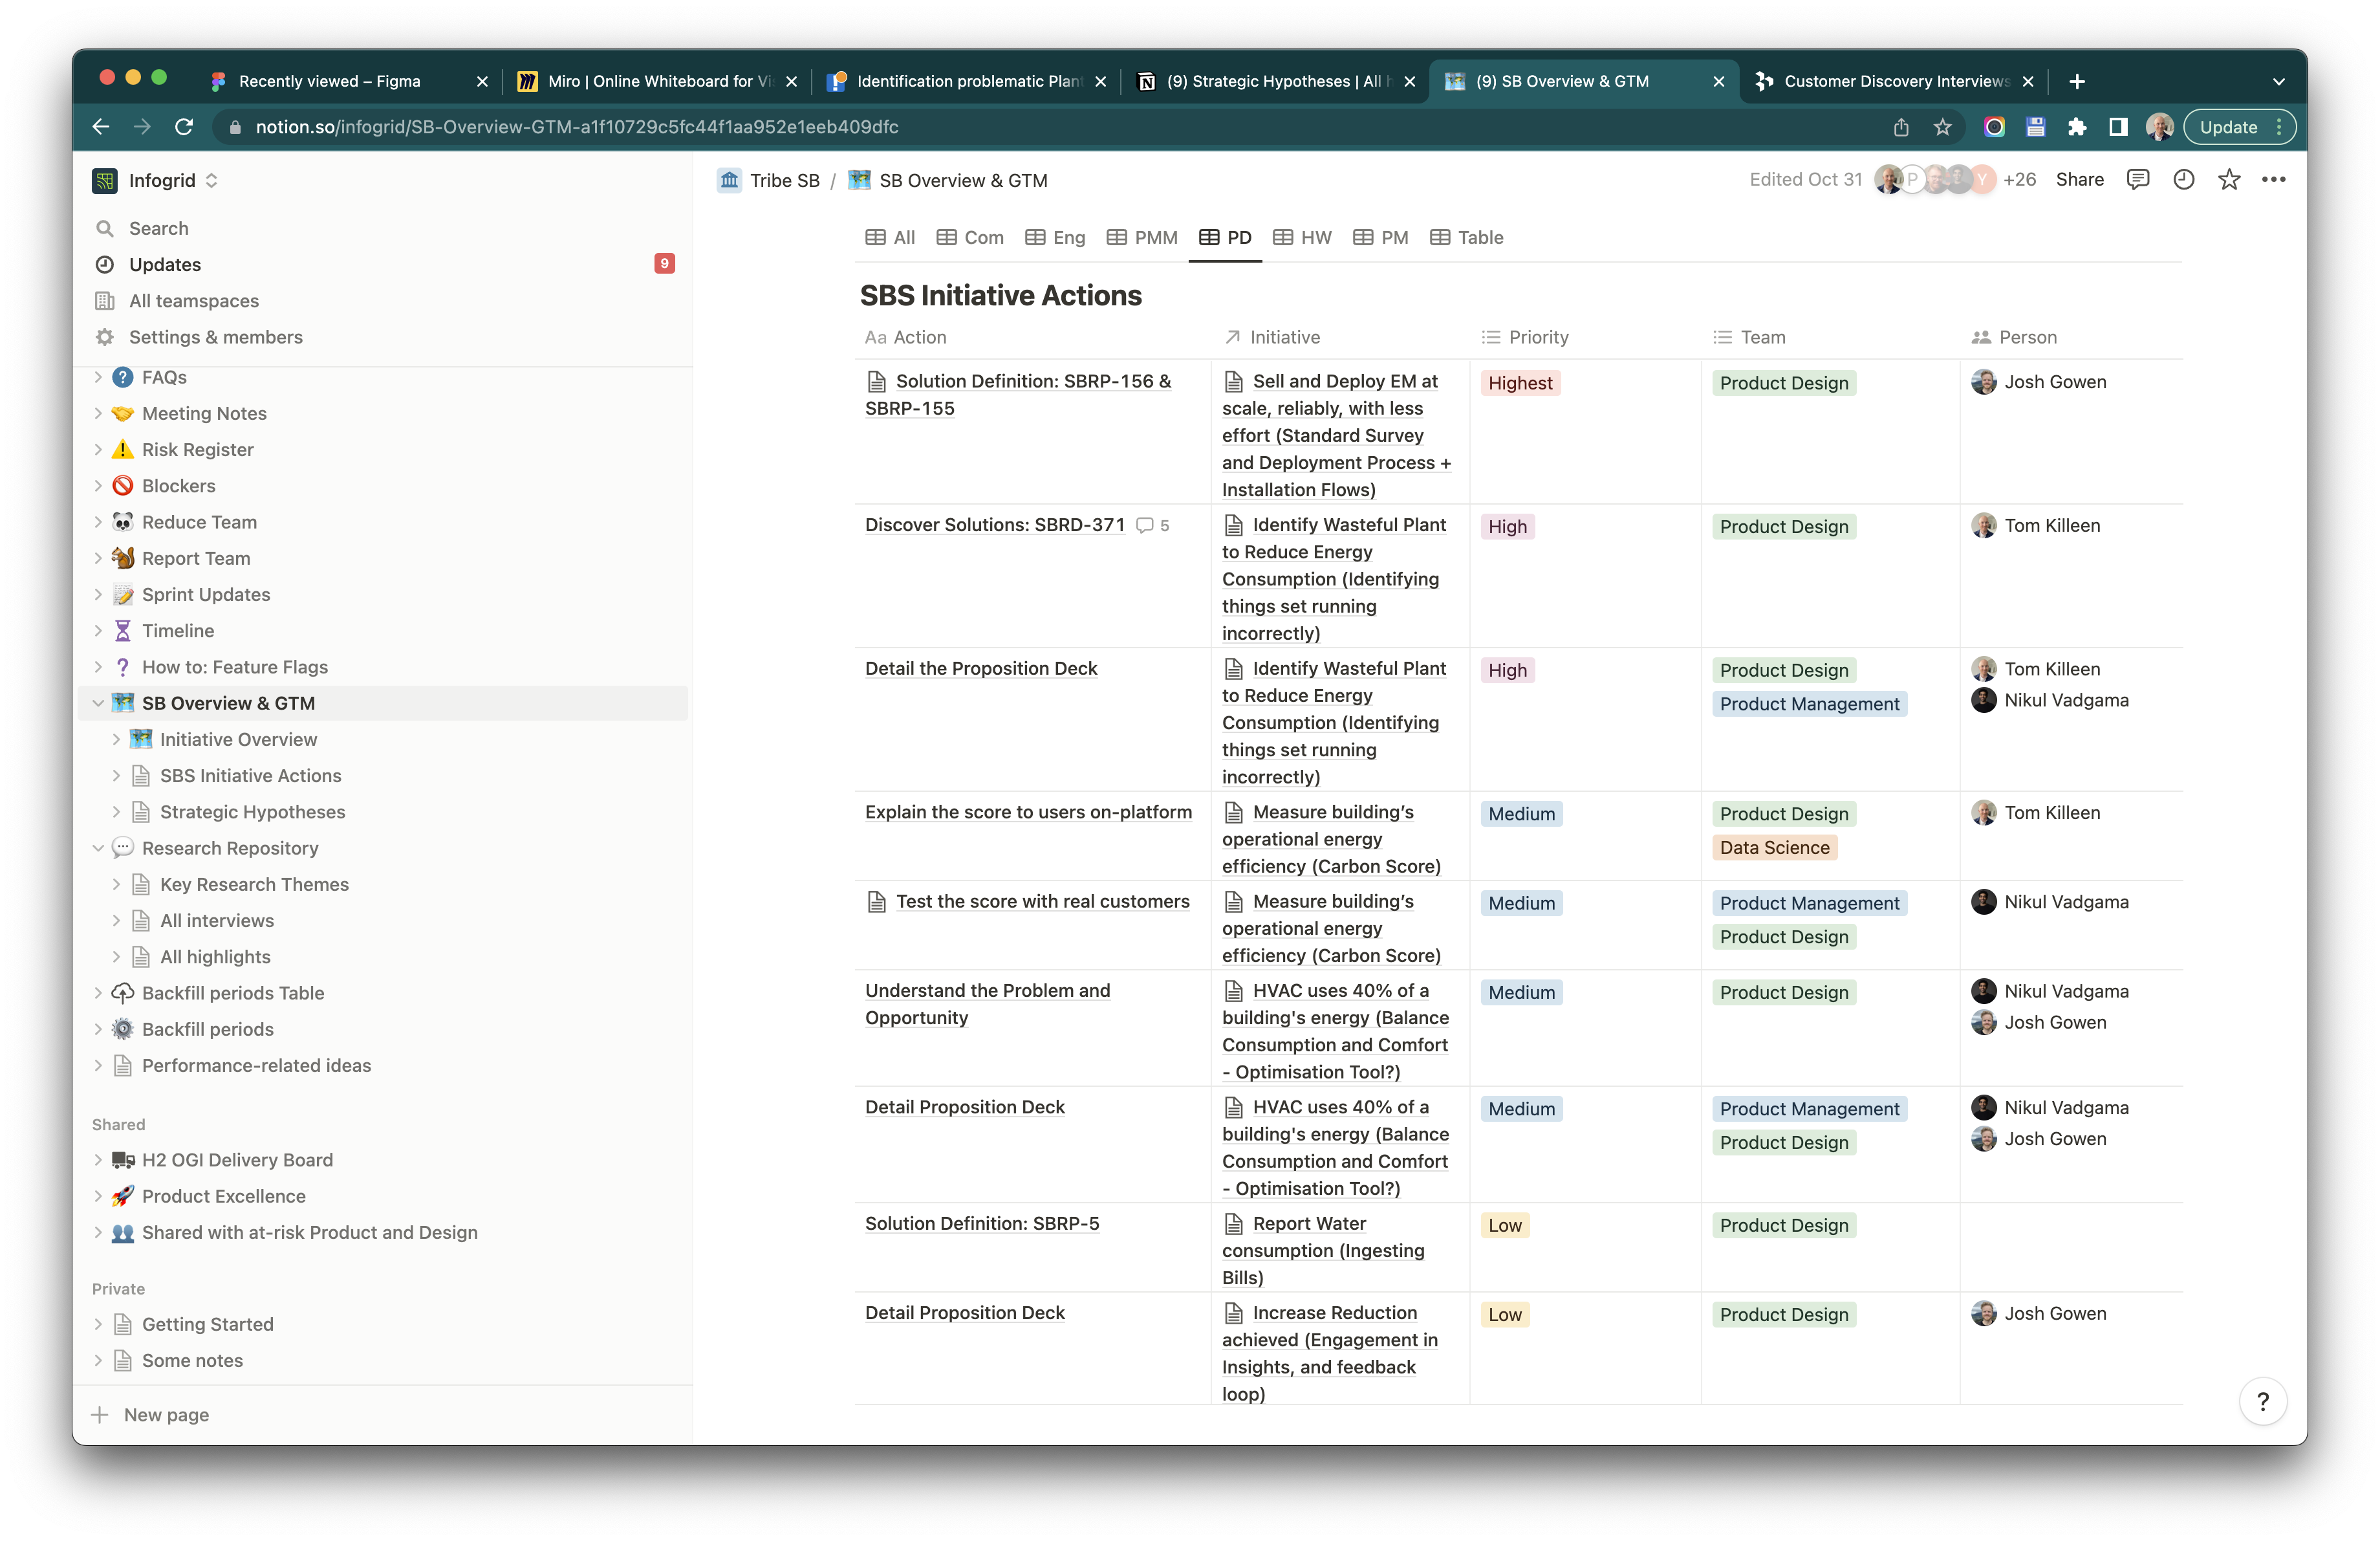
The solutions then became epics logged in Notion. The Senior Designer on my team and I worked through the epics to deliver detailed designs.
Information Architecture
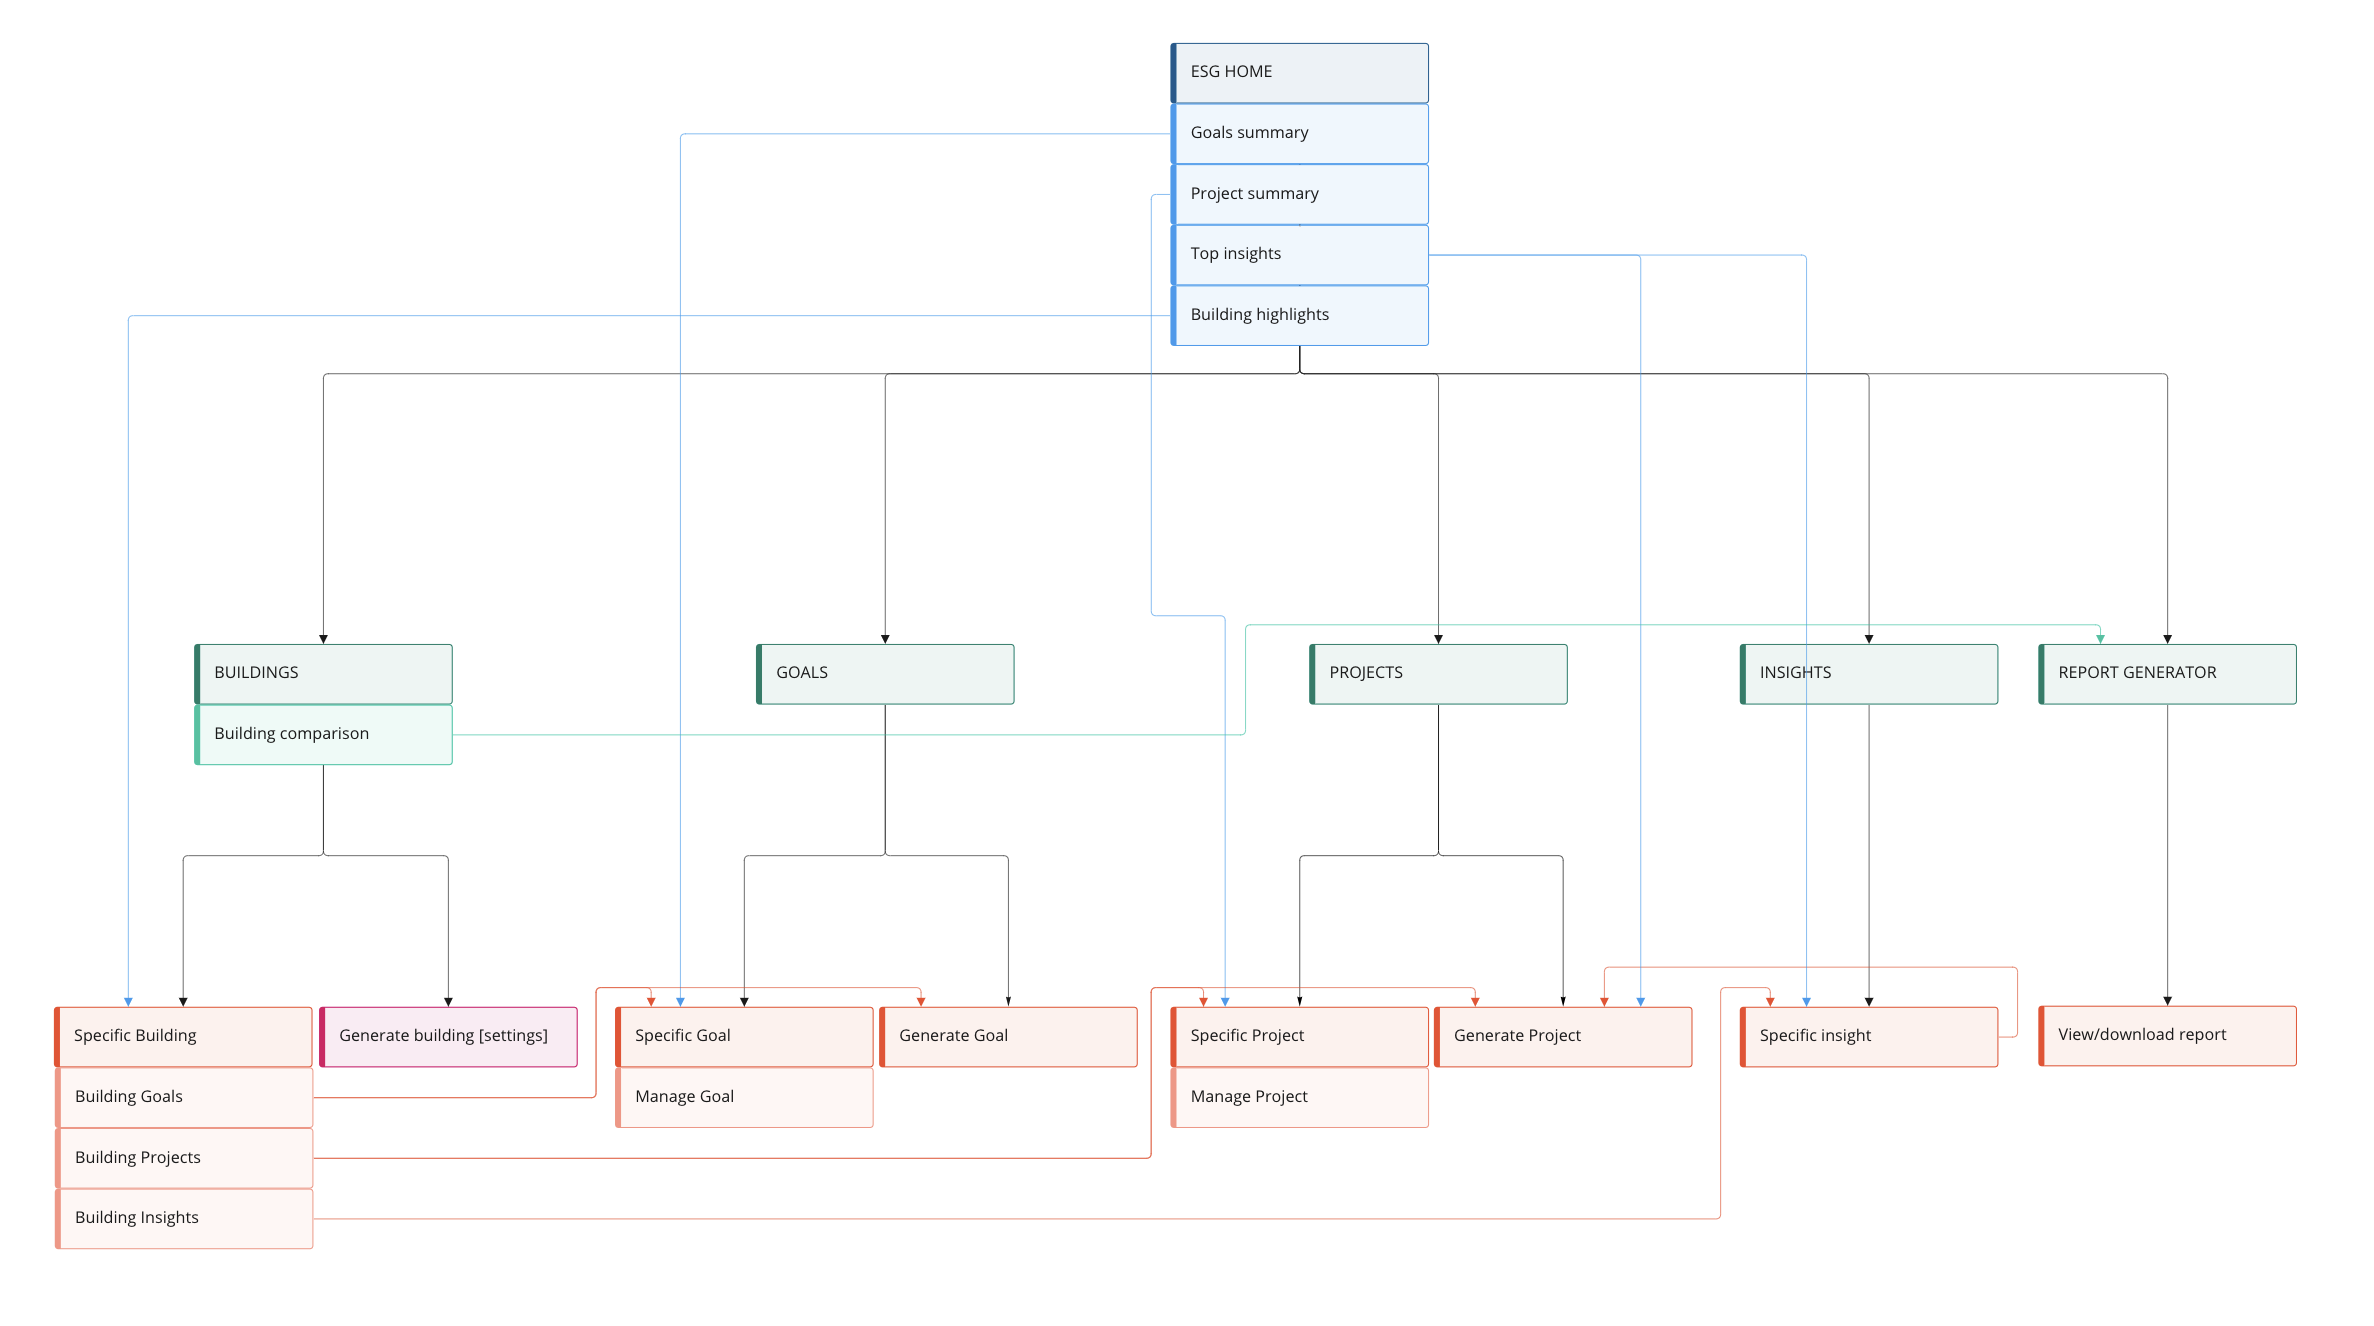
I owned information architecture end-to-end, producing page description diagrams, comprehensive sitemaps, and click-through prototypes guaranteeing short, logical user journeys.
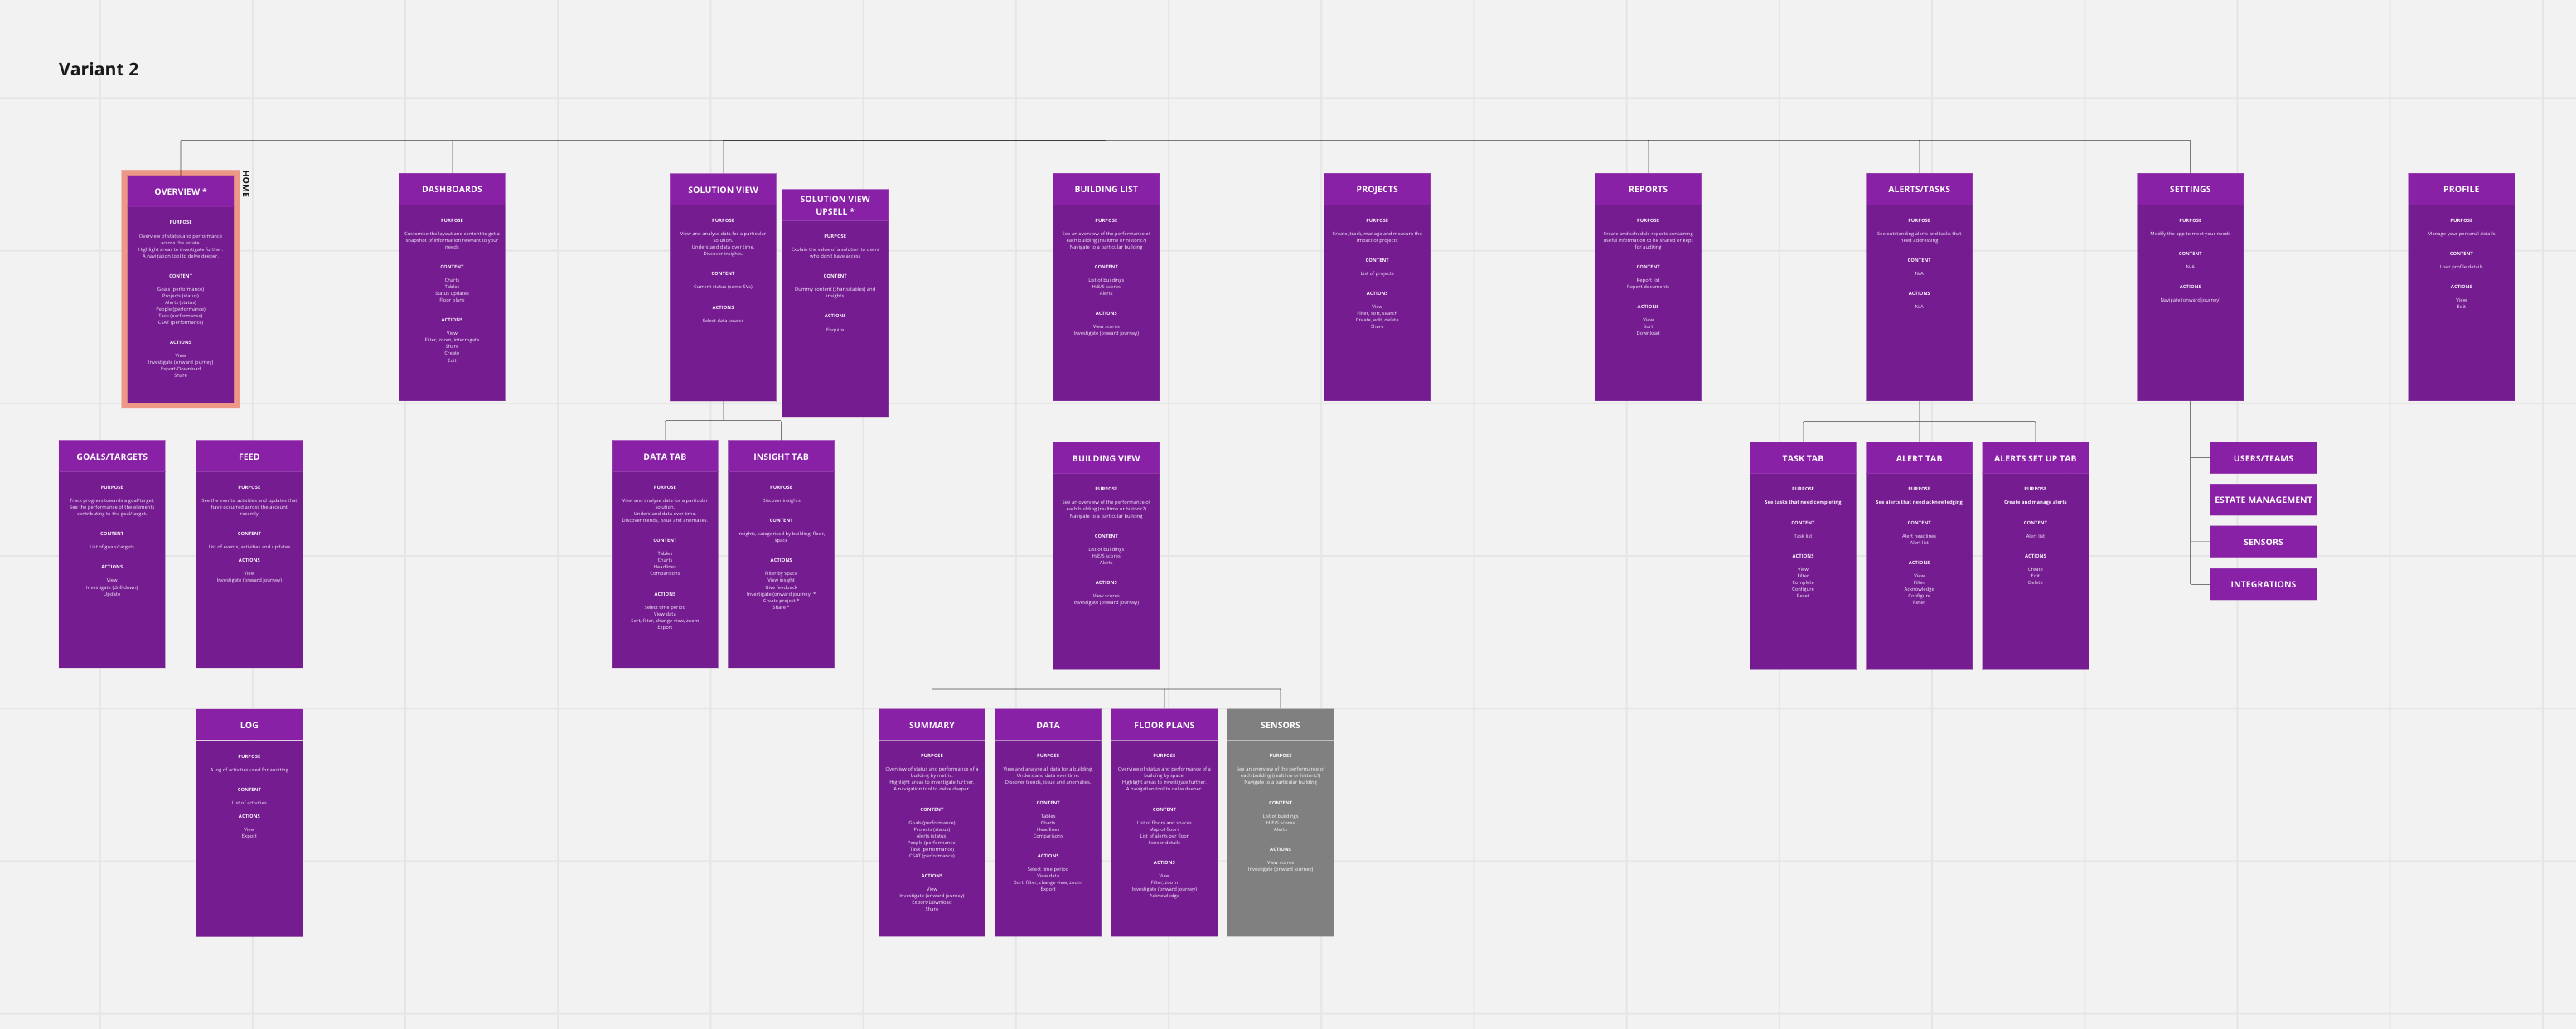
One of several site map variants created
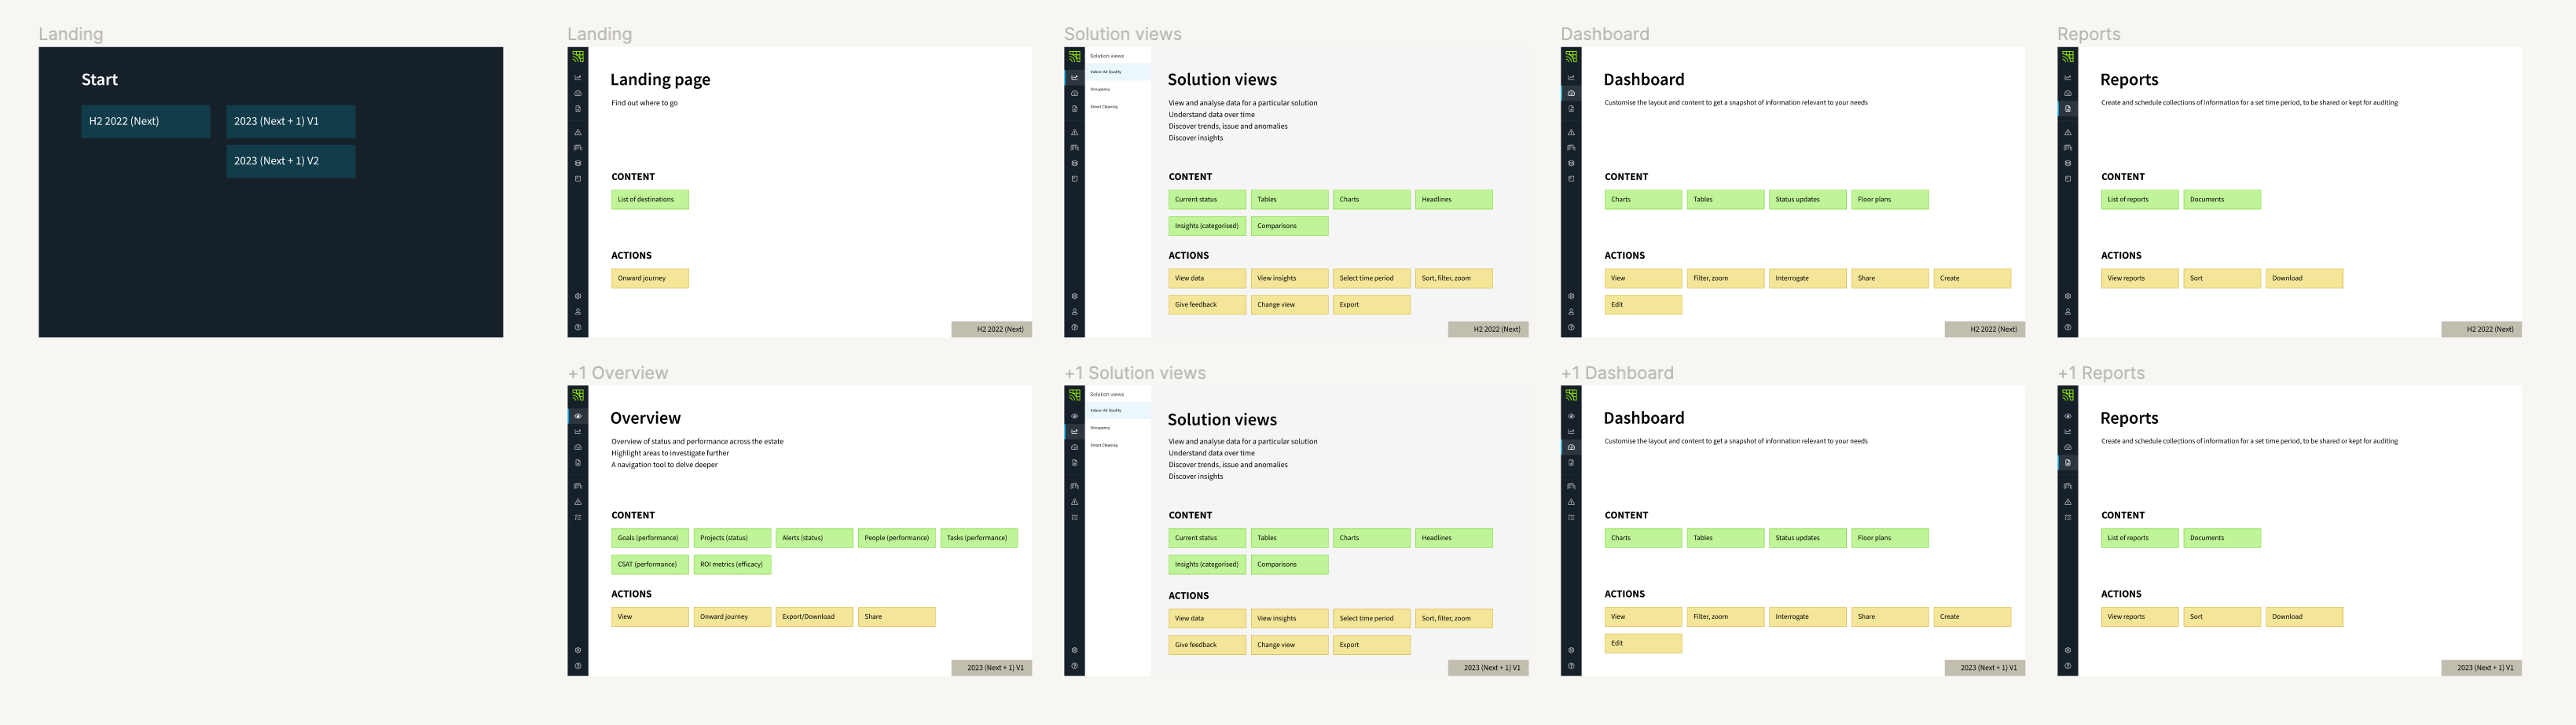
Click through page description prototype
Design System
I leveraged Infogrid’s Buffalo design system for rapid layout consistency while and introduced new components where existing patterns fell short.
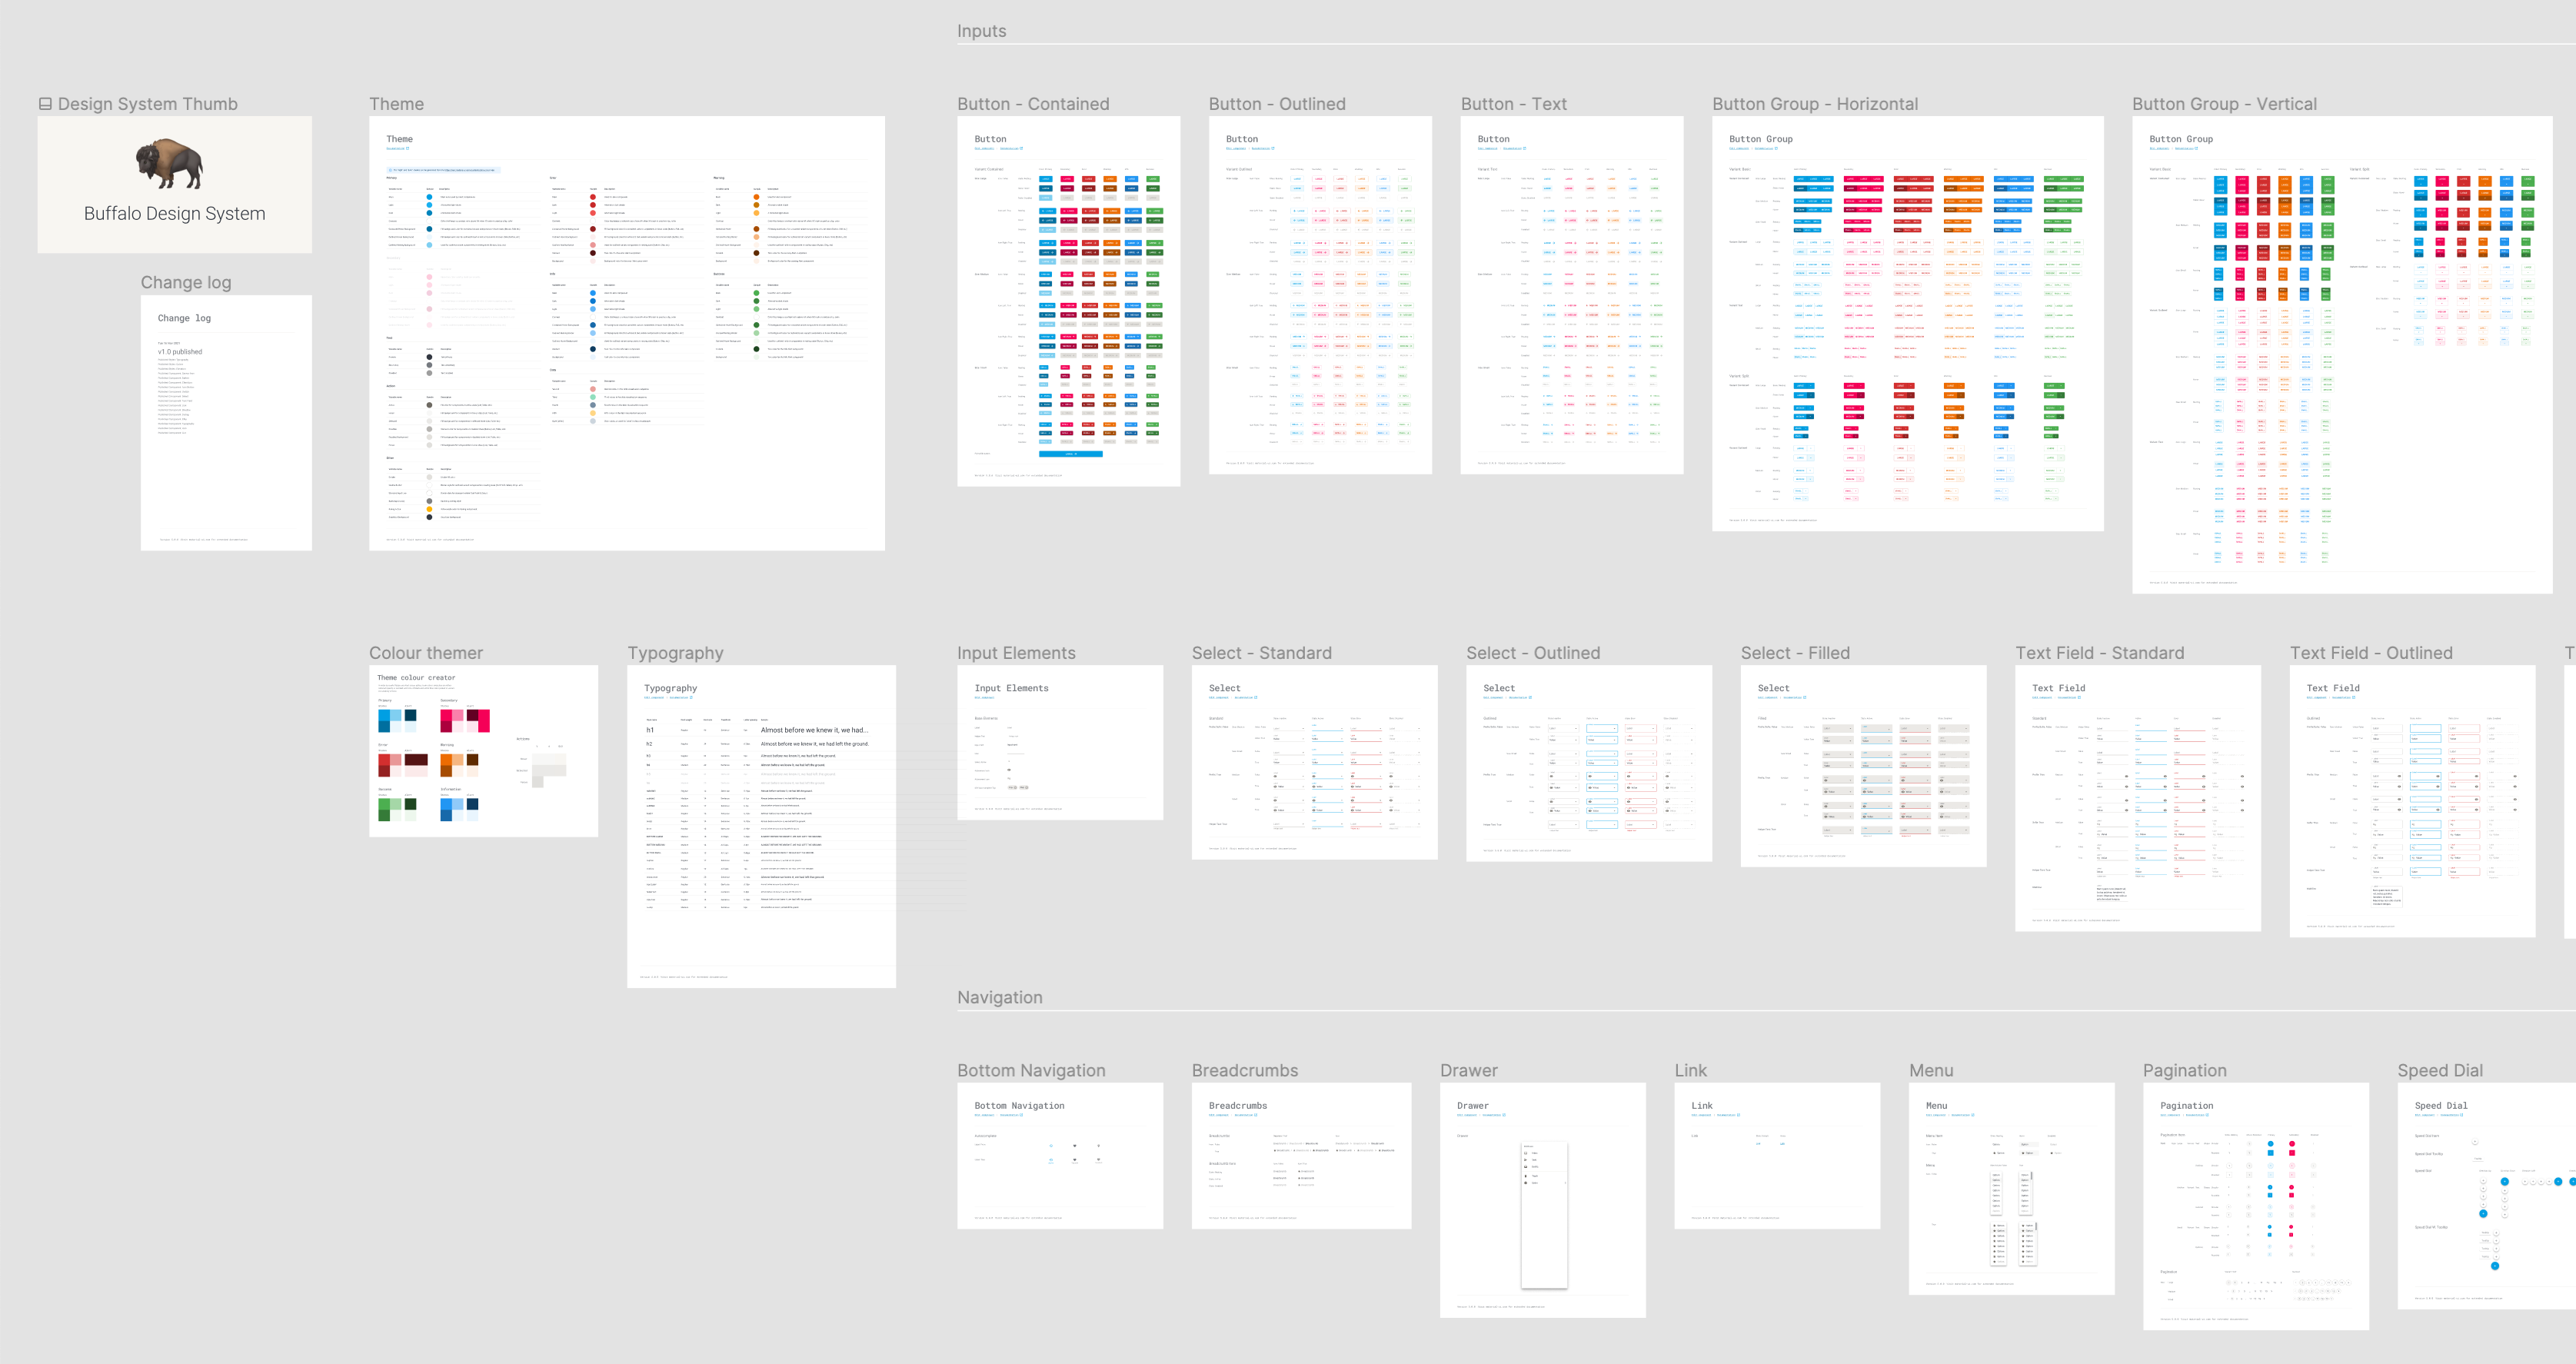
Delivery
I partnered closely with developers via regular reviews and open communication channels to preserve design intent and prevent last-minute scope drift.
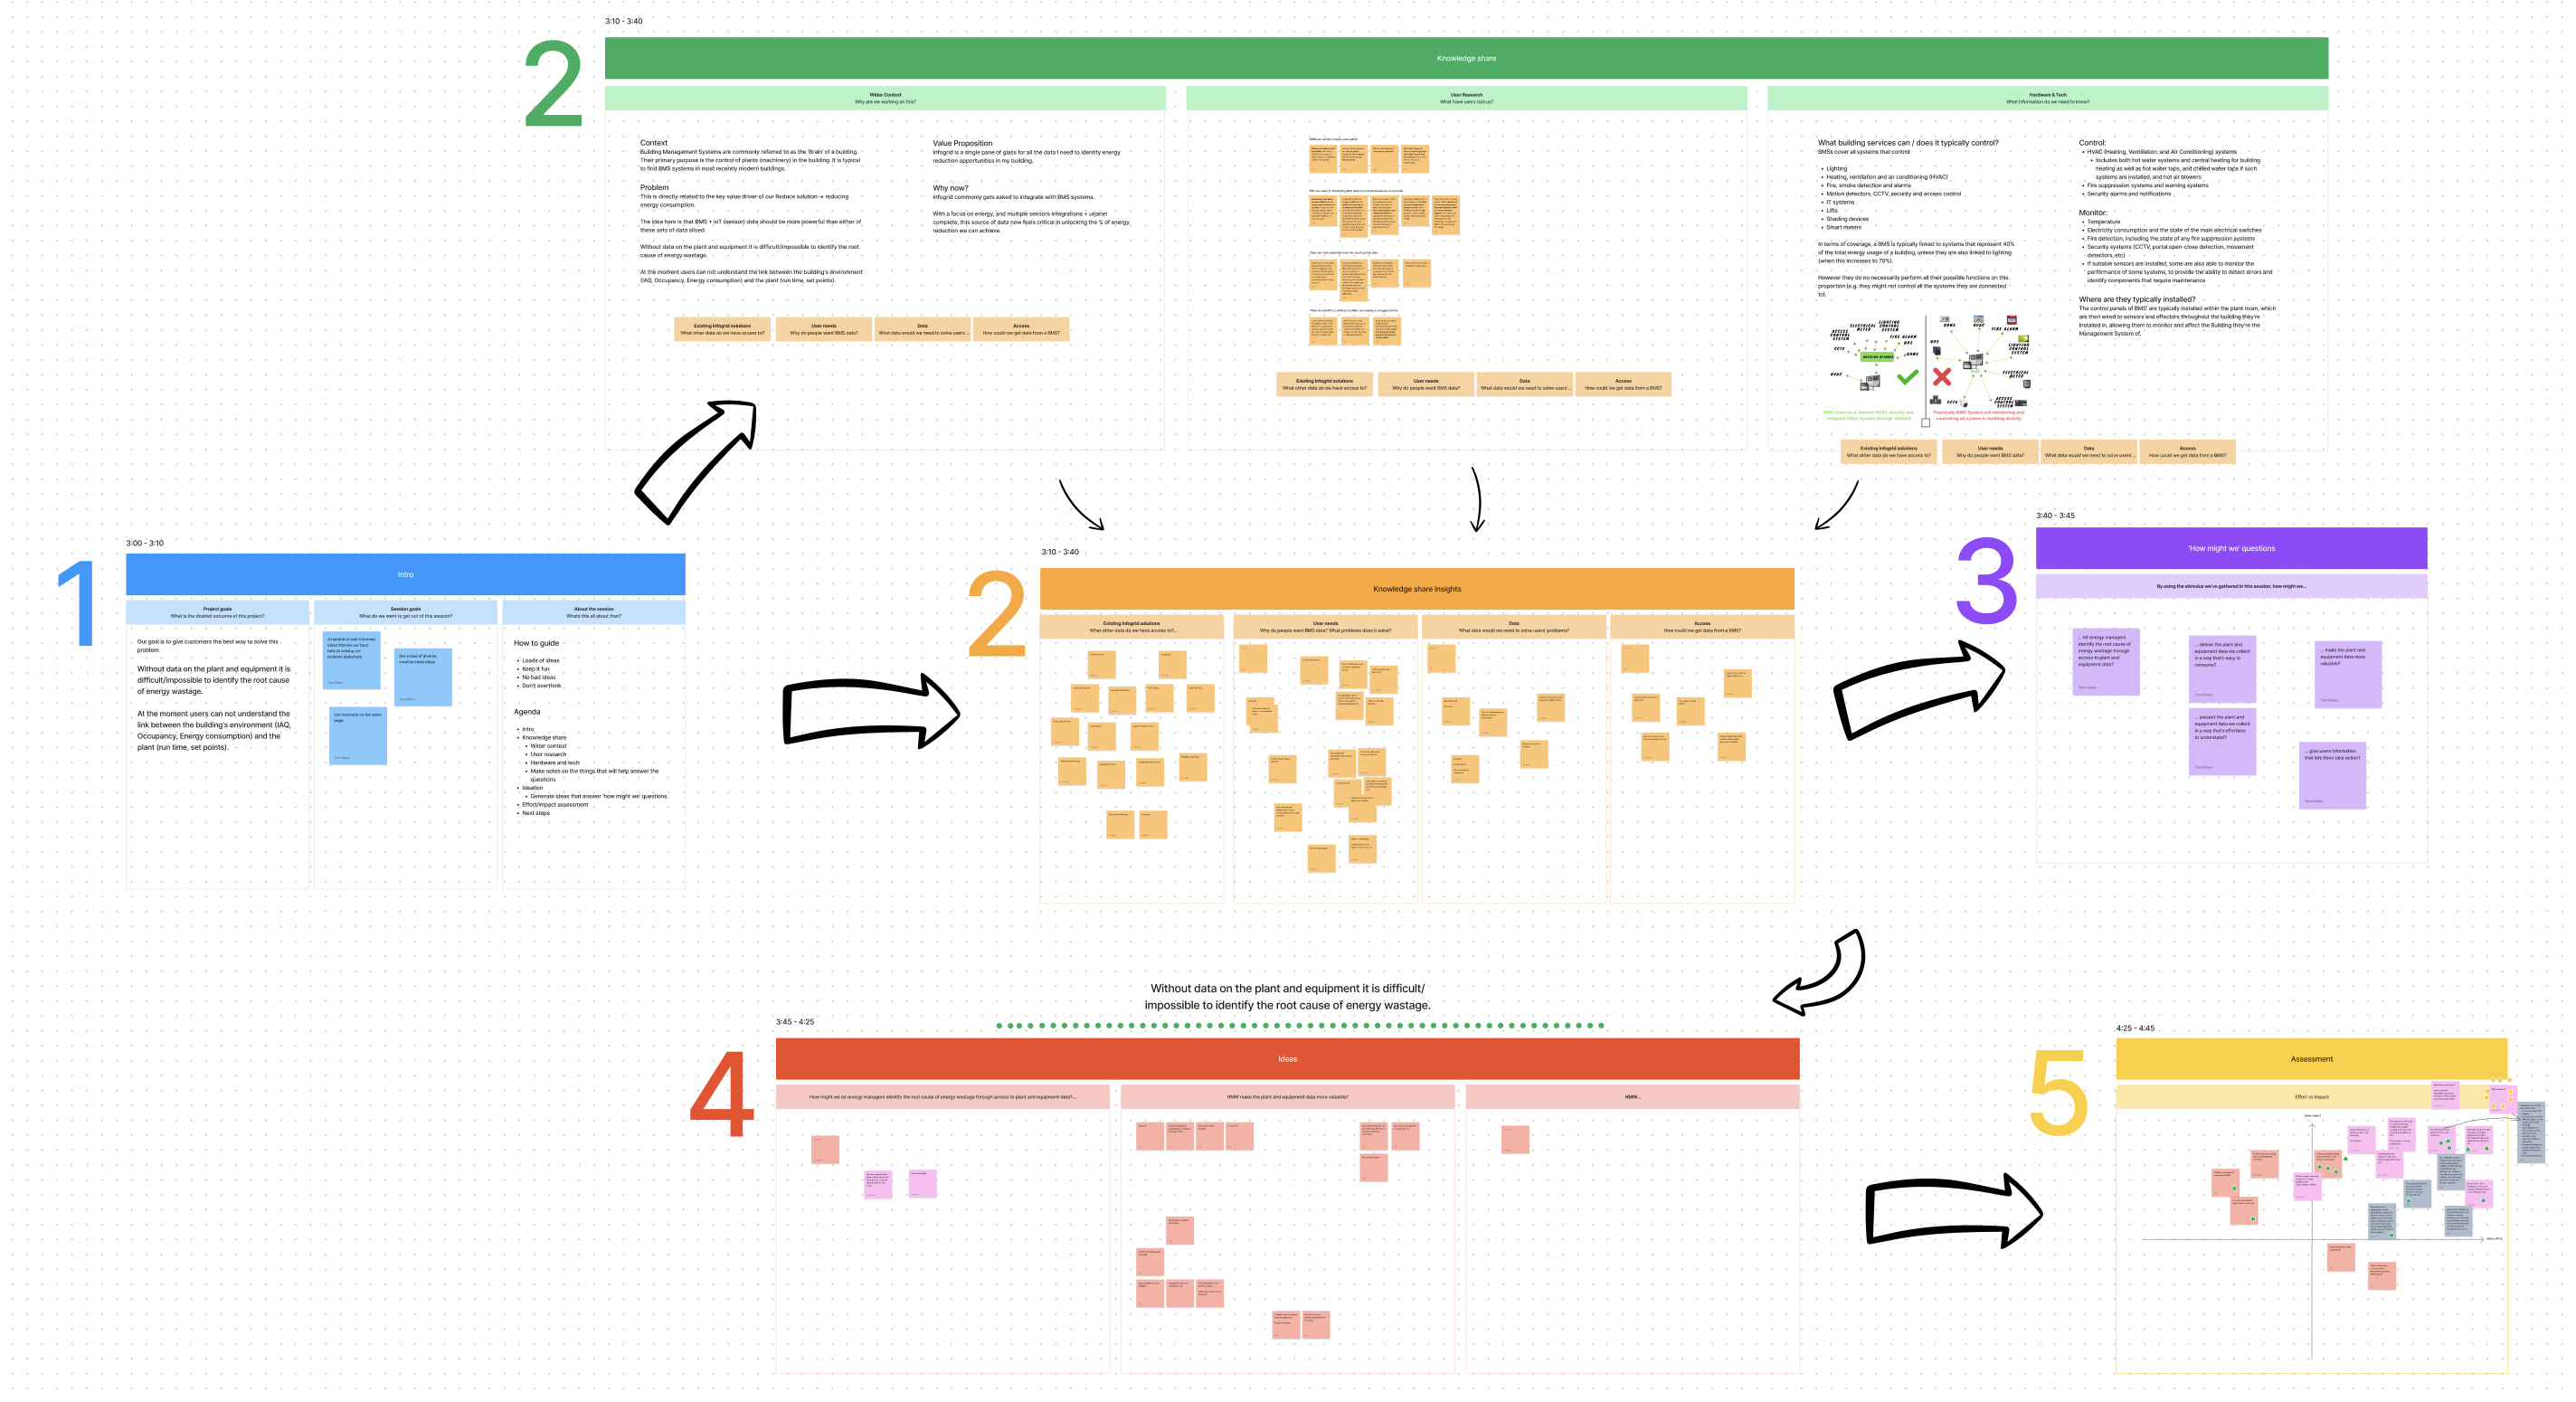
A planning workshop with engineers
Measuring Success
As a team we measured the success of released features through several channels.
Fullstory
I led a project to set up Fullstory on our product and used it to get qual and quant data of how the product is used.
Customer success
Feedback from the Customer Success team who work with the product and deal with customers on a day-to-day basis.
Customer interviews
I undertook several short user interviews to understand how the new features are being used and any opportunities for improvement.
We deployed FullStory to capture qualitative and quantitative behavioral data. Combined with customer success insights and direct user interviews, metrics showed a steady climb in active usage and visit frequency, leaving the sales team fully primed for market rollout.
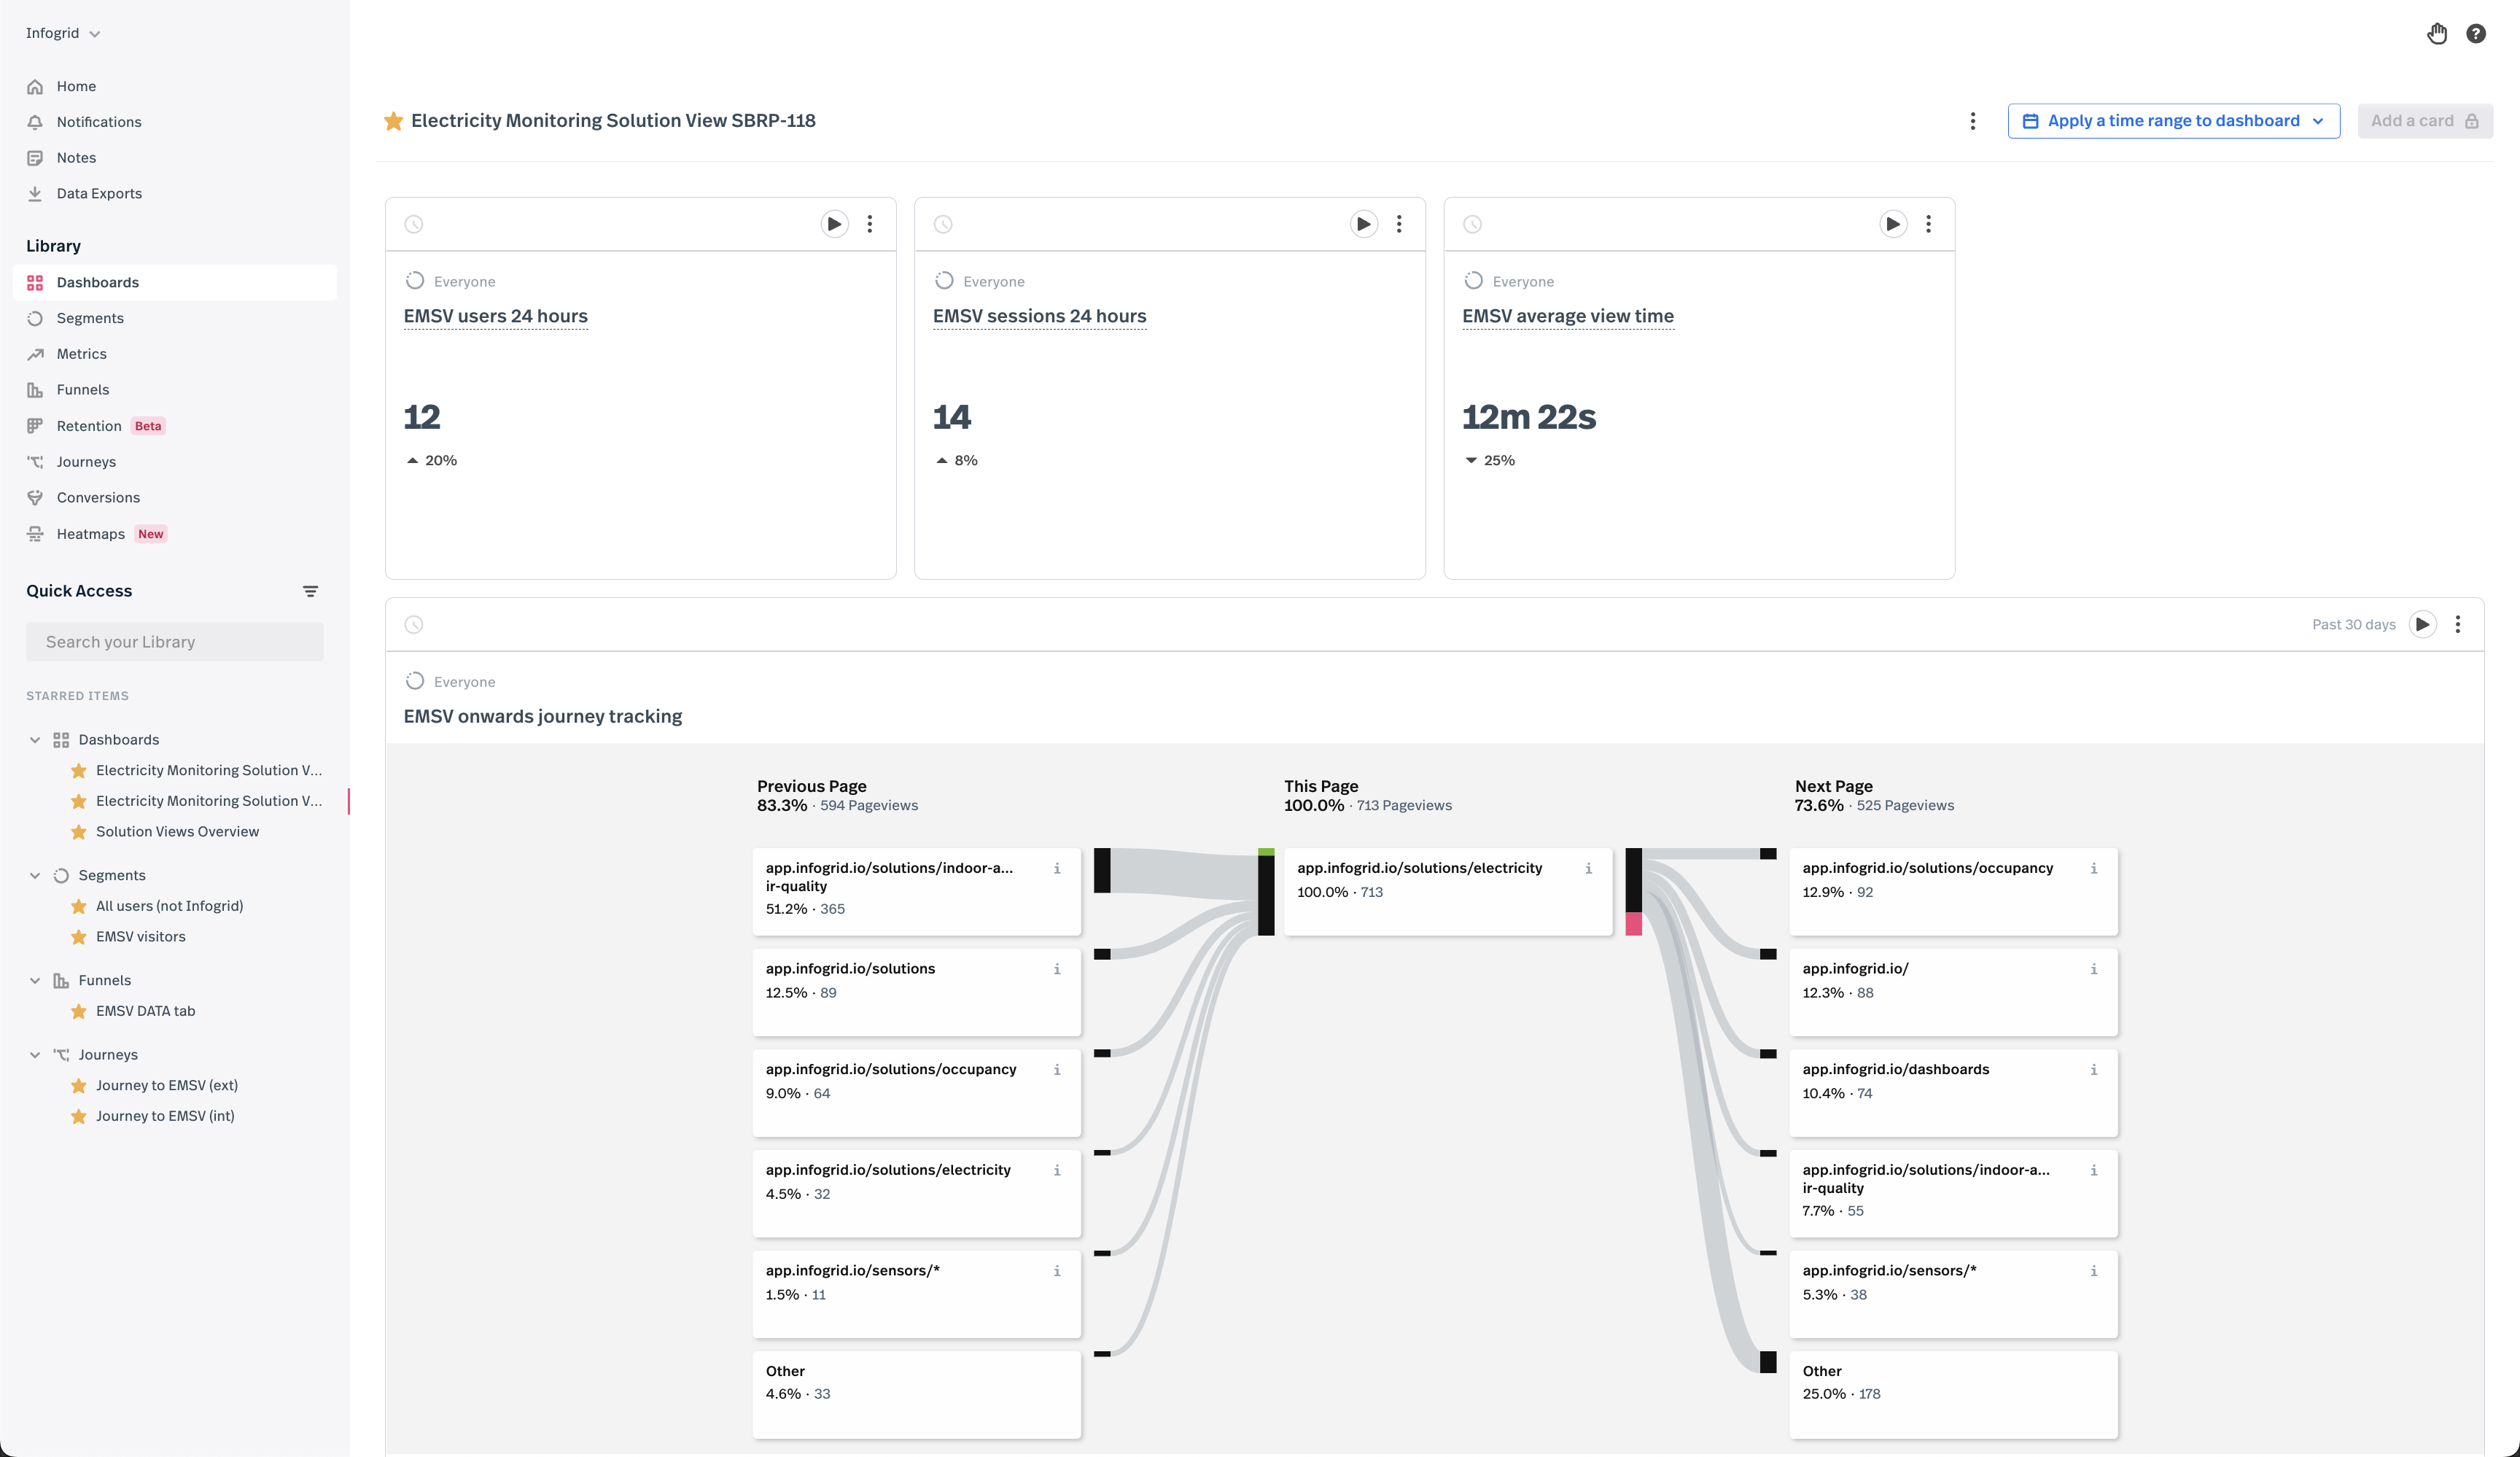
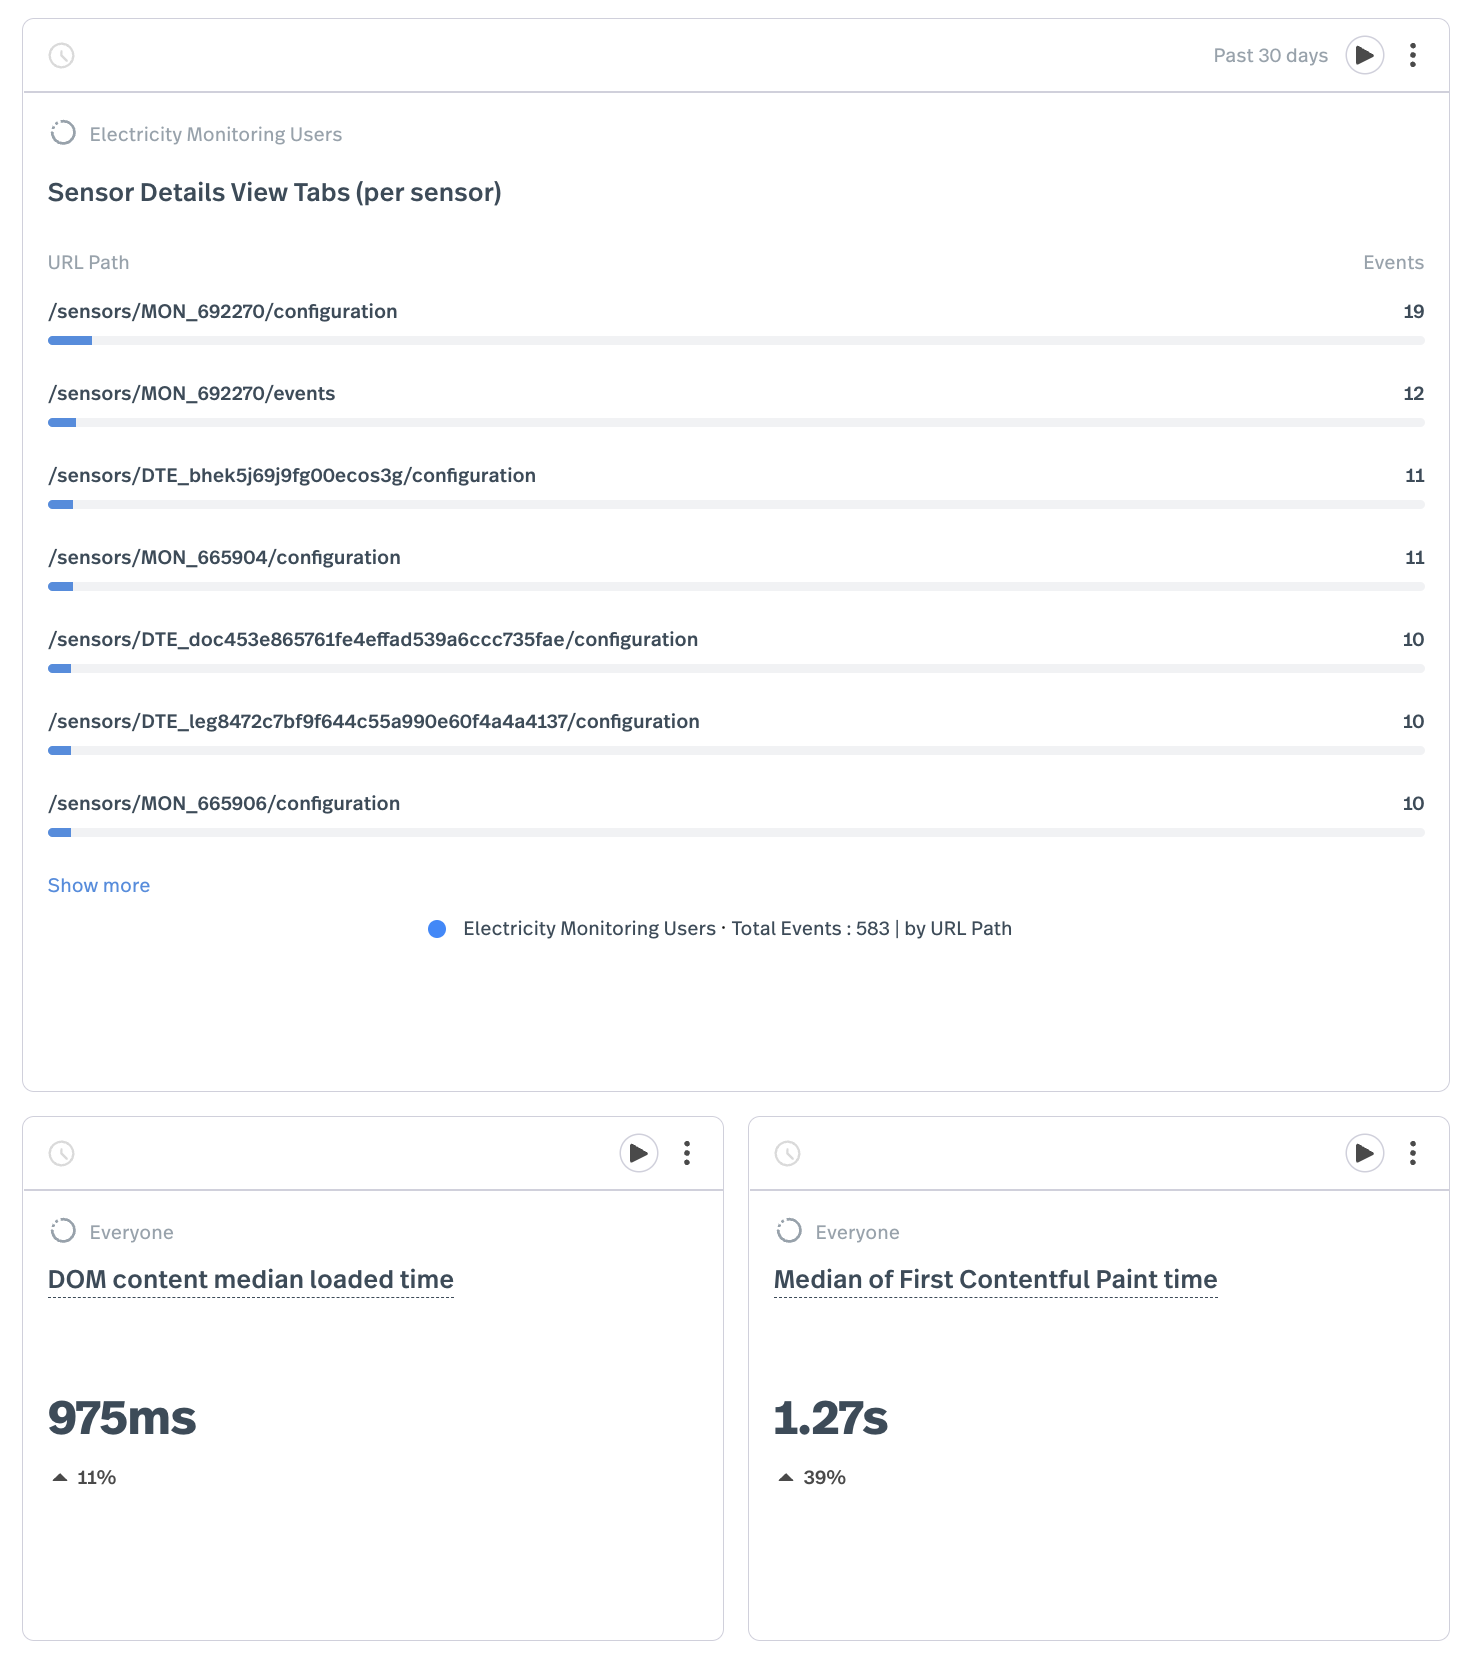
The Fullstory dashboard used to track product metrics
Credits
UX
Tom Killeen
Josh Gowen
Product
Nikul Vadgama
Alex Gordon-Lewis
Engineering
Filip Modrzejewski
William Di Pasquale
Data Science
Federico Garza de Leon
Felix Sanchez Garcia