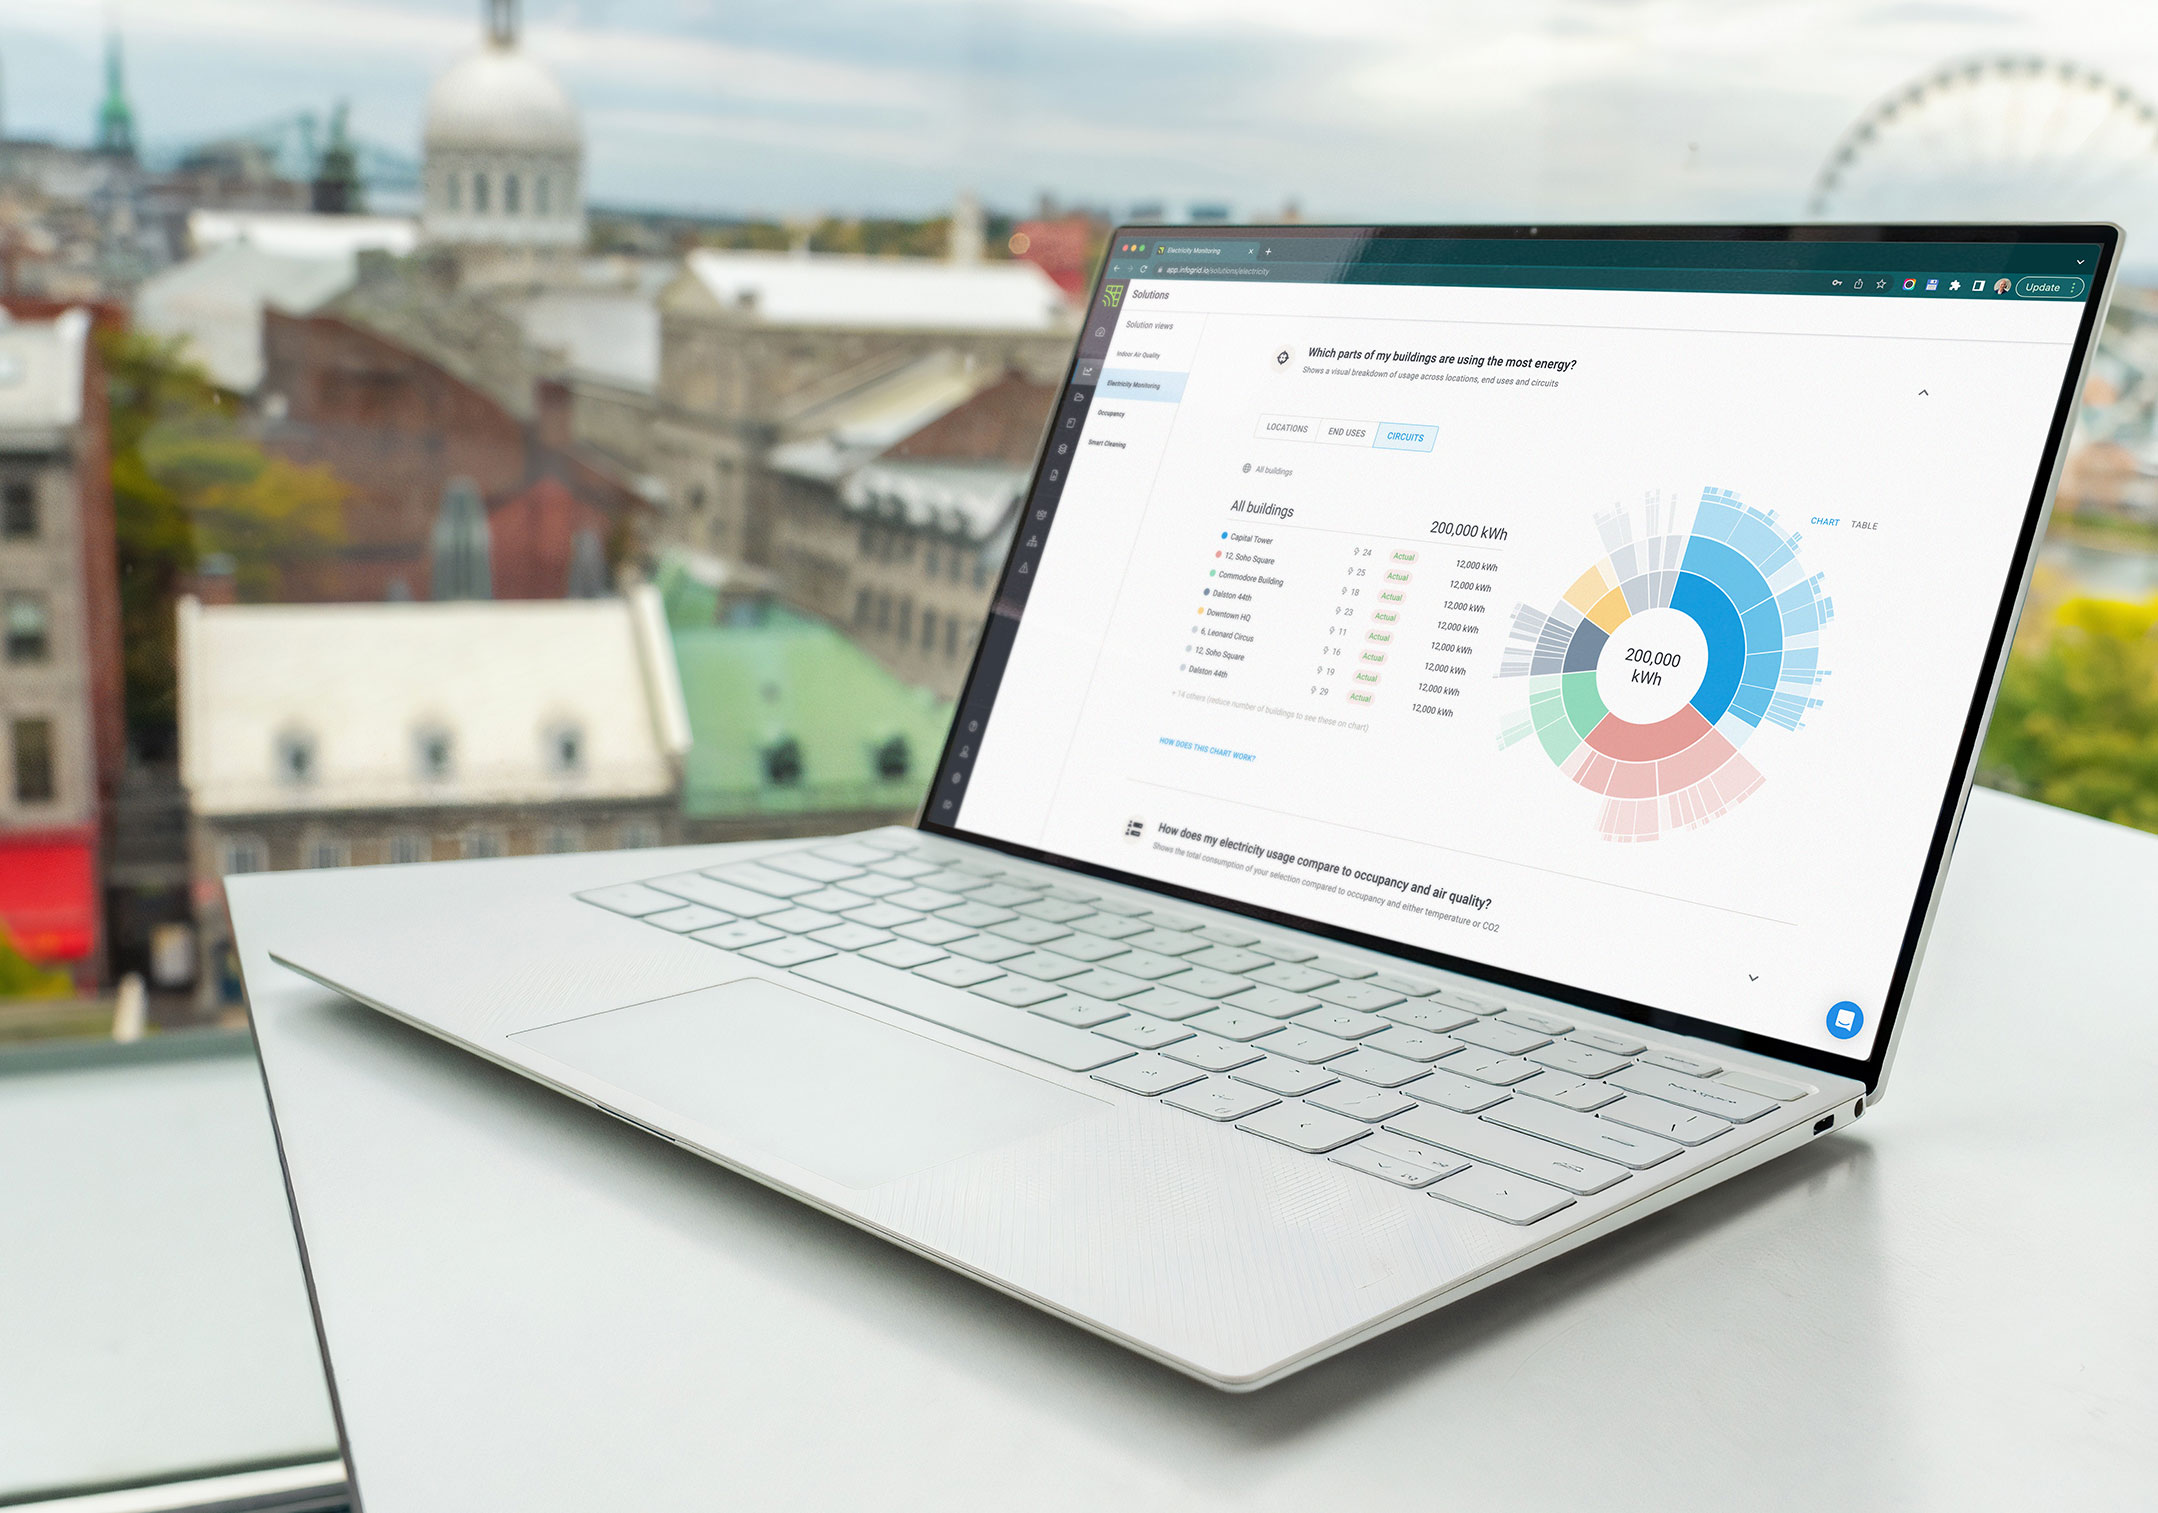
Infogrid realised deals that included energy were 2.5 times larger. The goal was to turn its basic energy-monitoring beta into a product that won those bigger deals.
As Product Design Lead, I owned the research, concept testing and design. My research changed the product's direction twice: from reporting to cutting energy, and from more charts to energy in context.
COMPANY
Infogrid, a smart building platform that uses sensors to monitor commercial buildings
MY ROLE
Product Design & Research Lead
GOAL
Increase ARR
TOOLS
Figma, ProtoPie, Dovetail, Notion, FullStory
60%+
growth in ARR
£35k
average savings per building
£4M
sales pipeline built
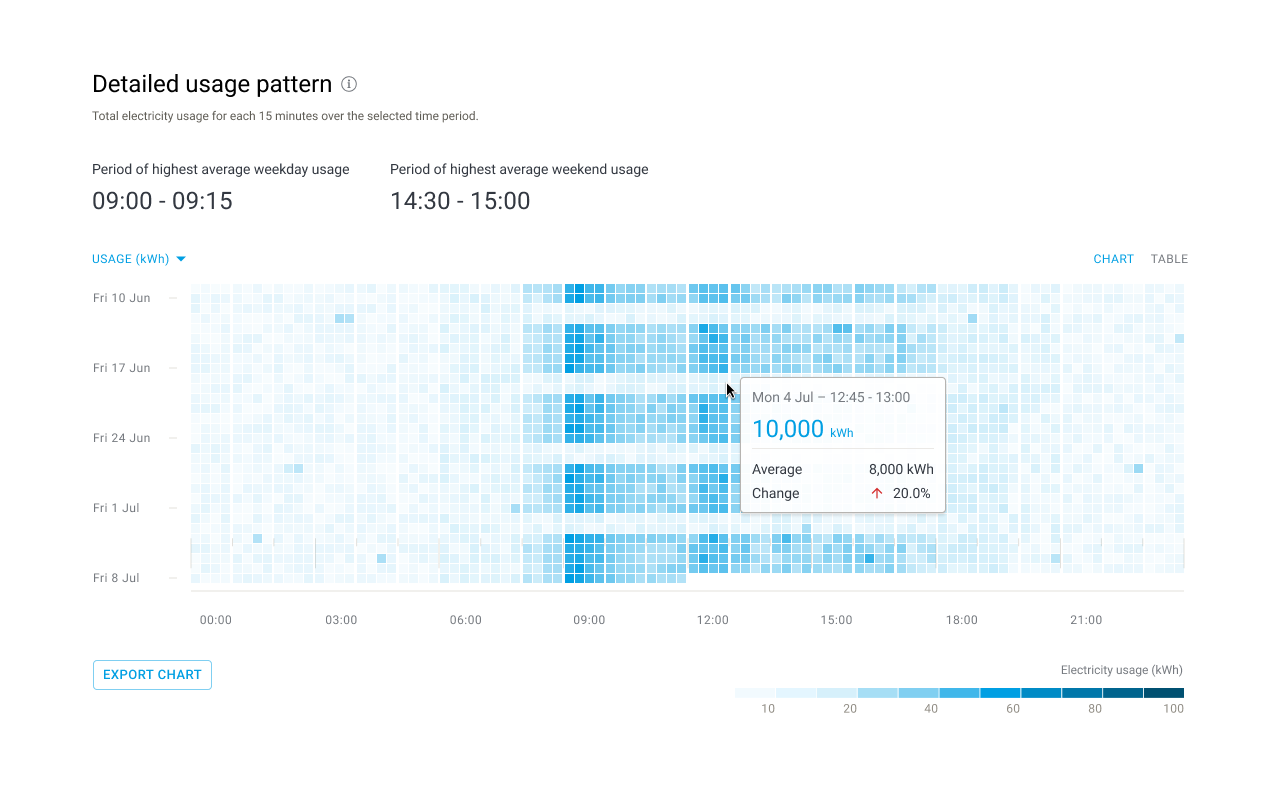
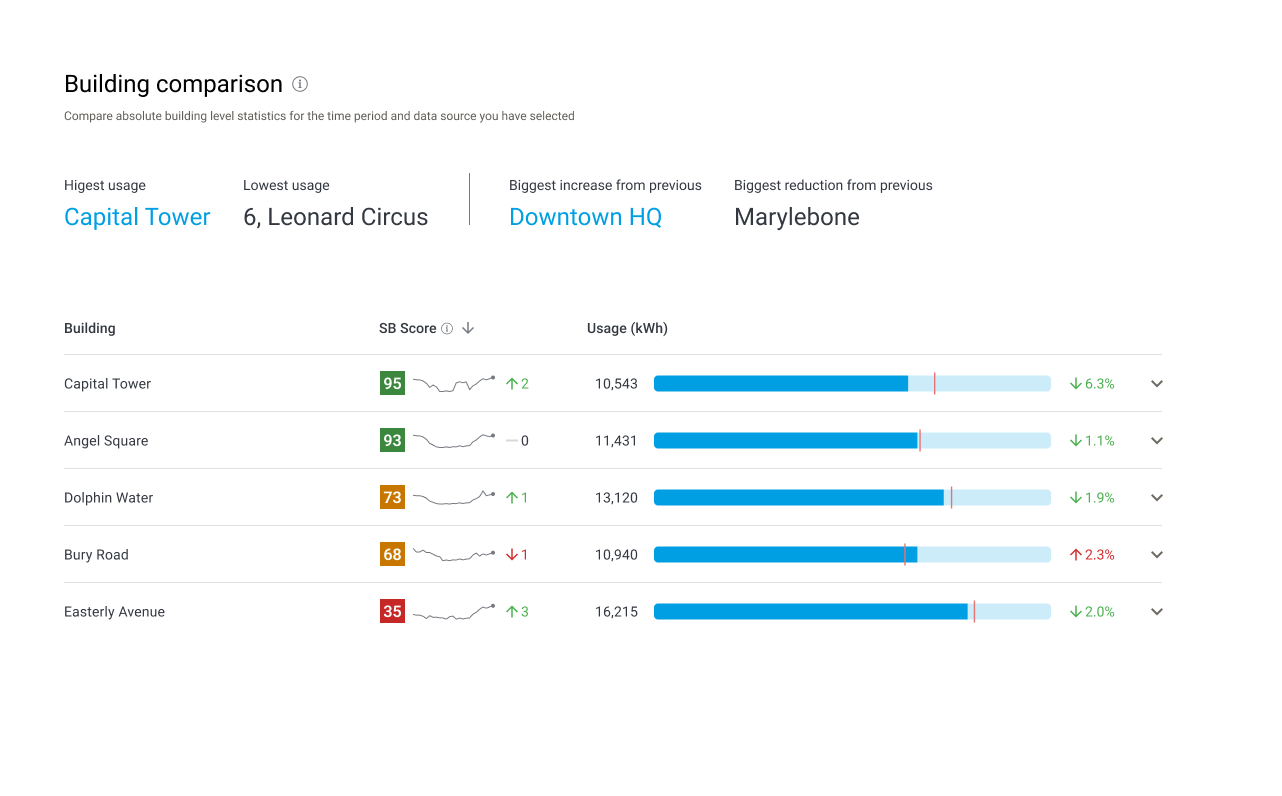
Examples of new features added to the product
Problem
Bills and meter data arrived weeks or months late, often as estimates. Energy managers wanted a live picture of how a building was running so they could act before waste piled up. Infogrid's sensors could deliver that data in real time. The hard part was working out how to make it useful.
Process
Research. Energy management was new to me, so I went straight to the people who do it. I interviewed energy managers at large property and facilities management firms and analysed the findings in Dovetail.
I uncovered big, unsolved problems in cutting waste. Data arrived too late to act on, so they were always reacting, and savings hid in simple patterns like heating left on all summer.
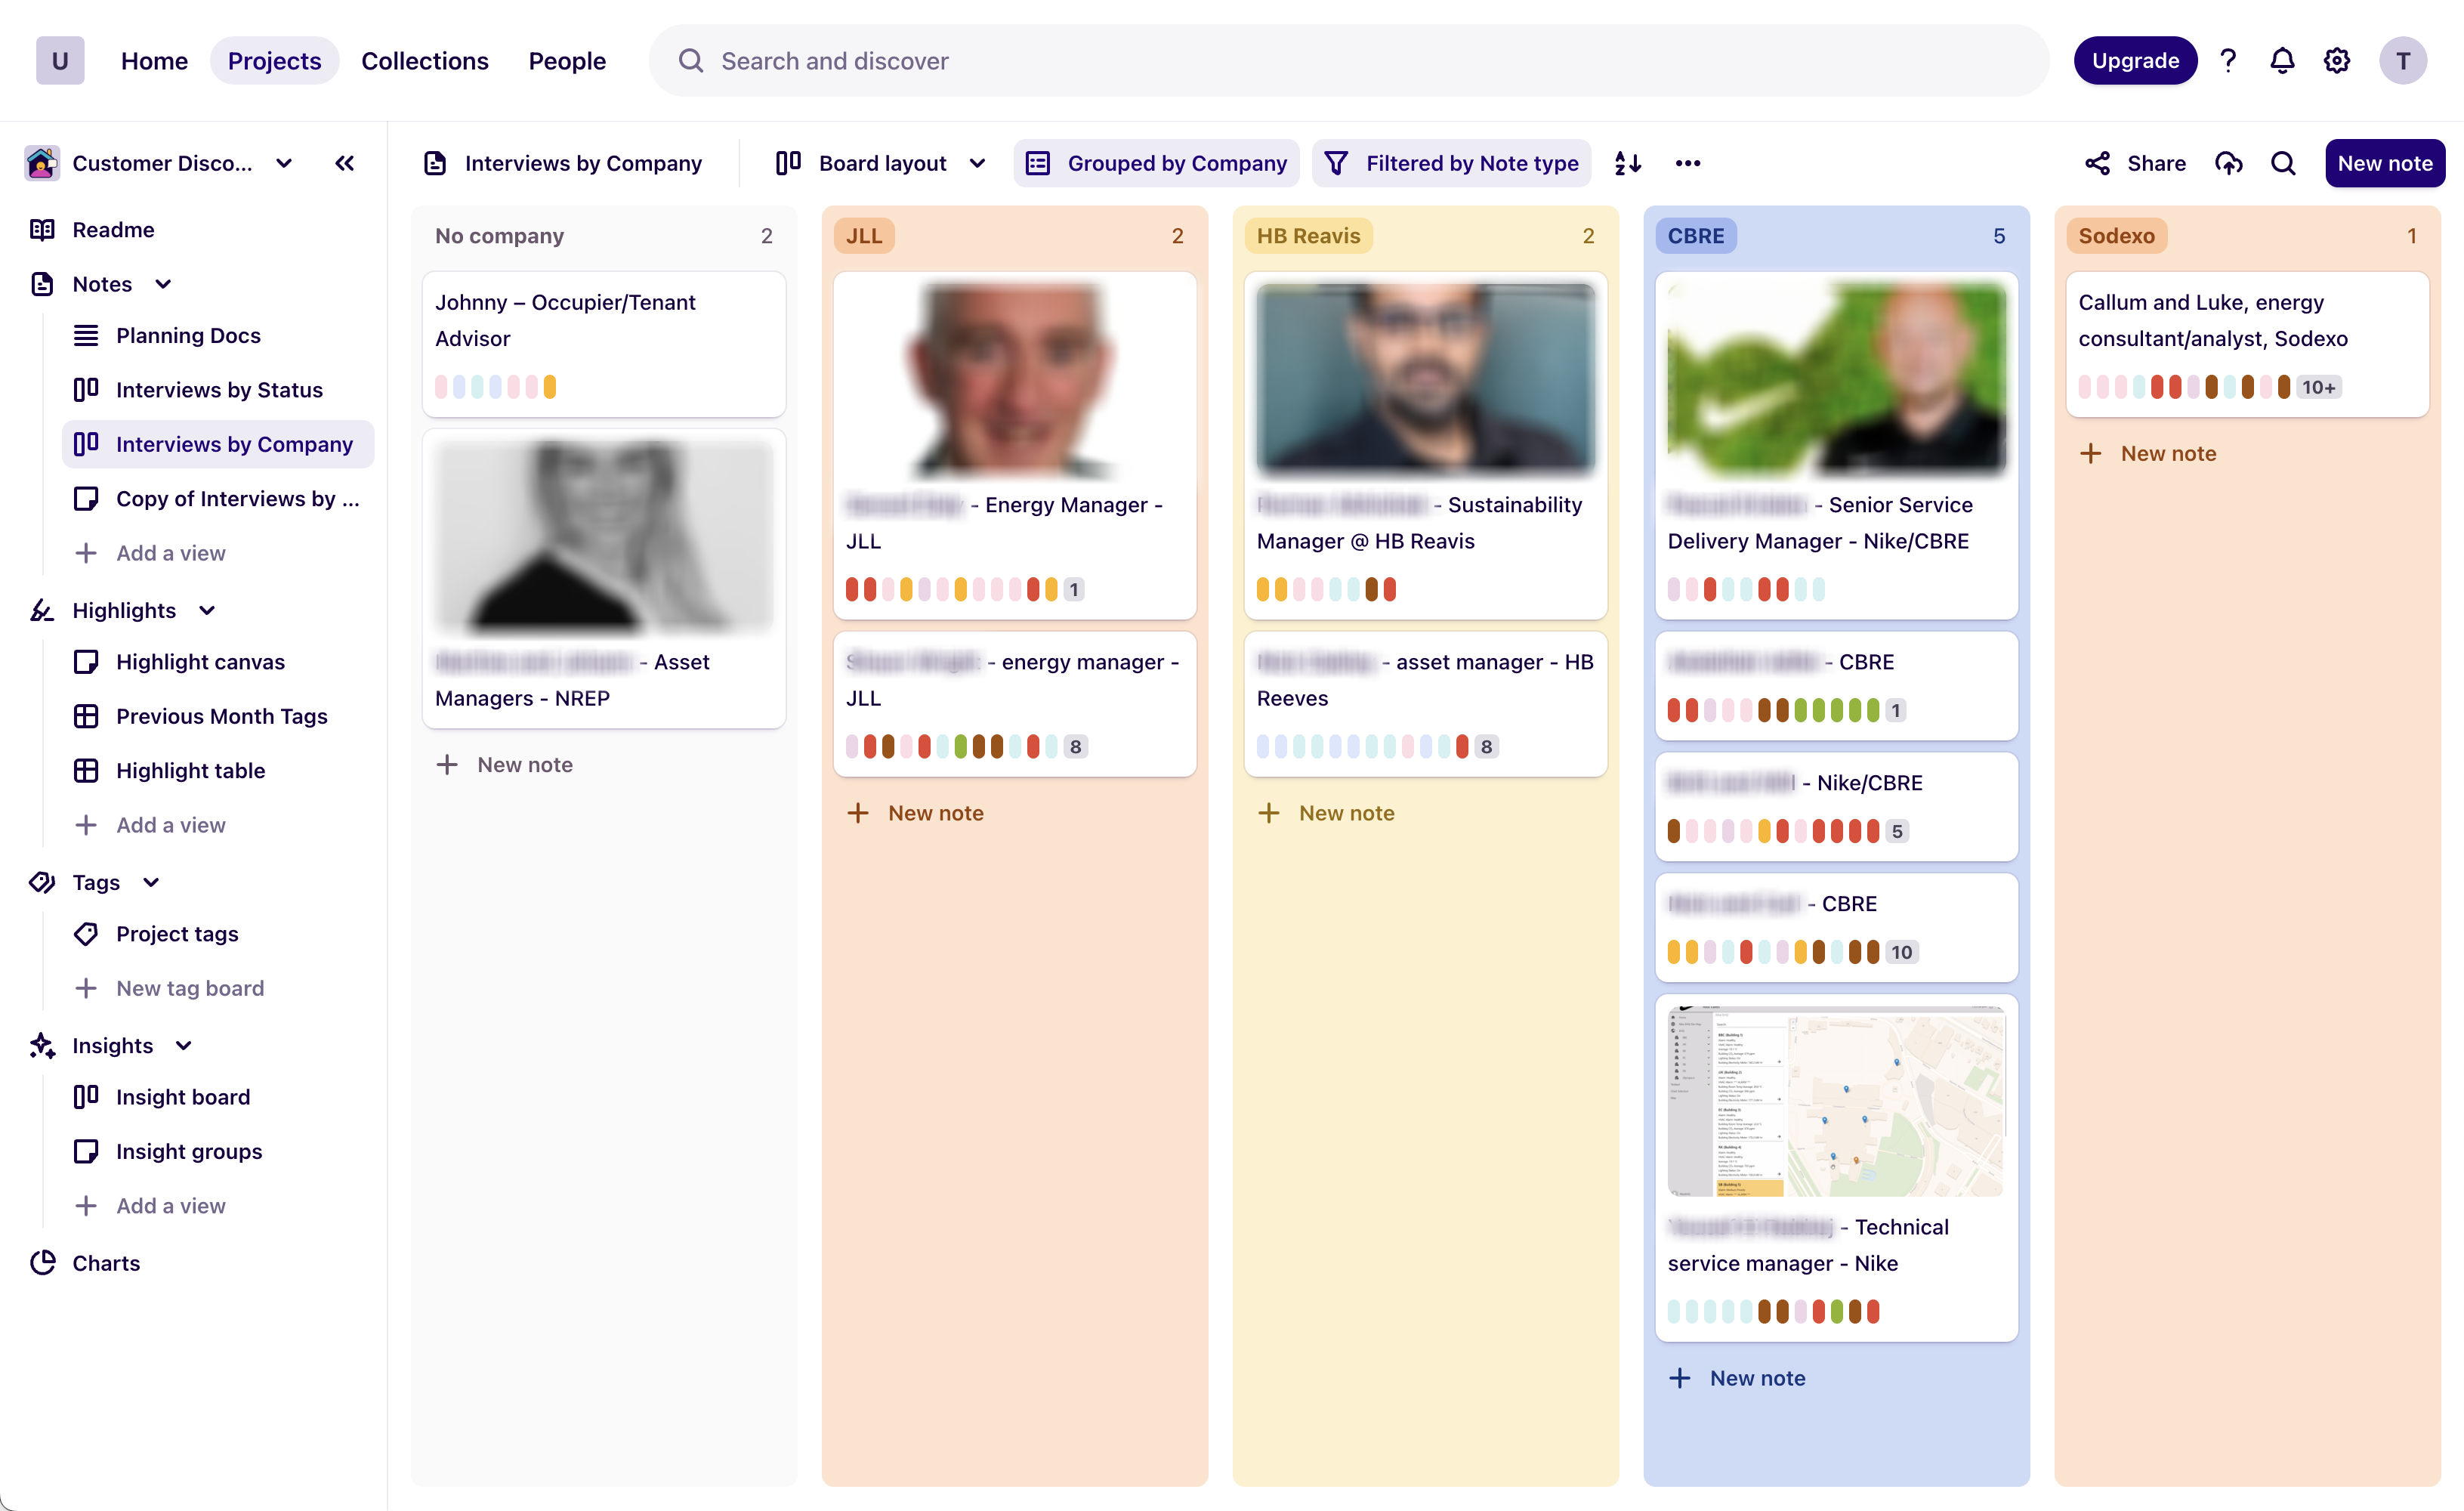
Managing interviews in Dovetail
Product strategy. The original plan was a sustainability reporting tool for landlords, which meant a feature race against established competitors. My research pointed somewhere better.
The sharpest pain was cutting energy, not reporting on it. We moved to reduction first, kept reporting as a supporting feature, and designed for one person: the energy manager.
The stance was an assistant, not a replacement. Automate the repetitive work so energy managers can focus on cutting energy.
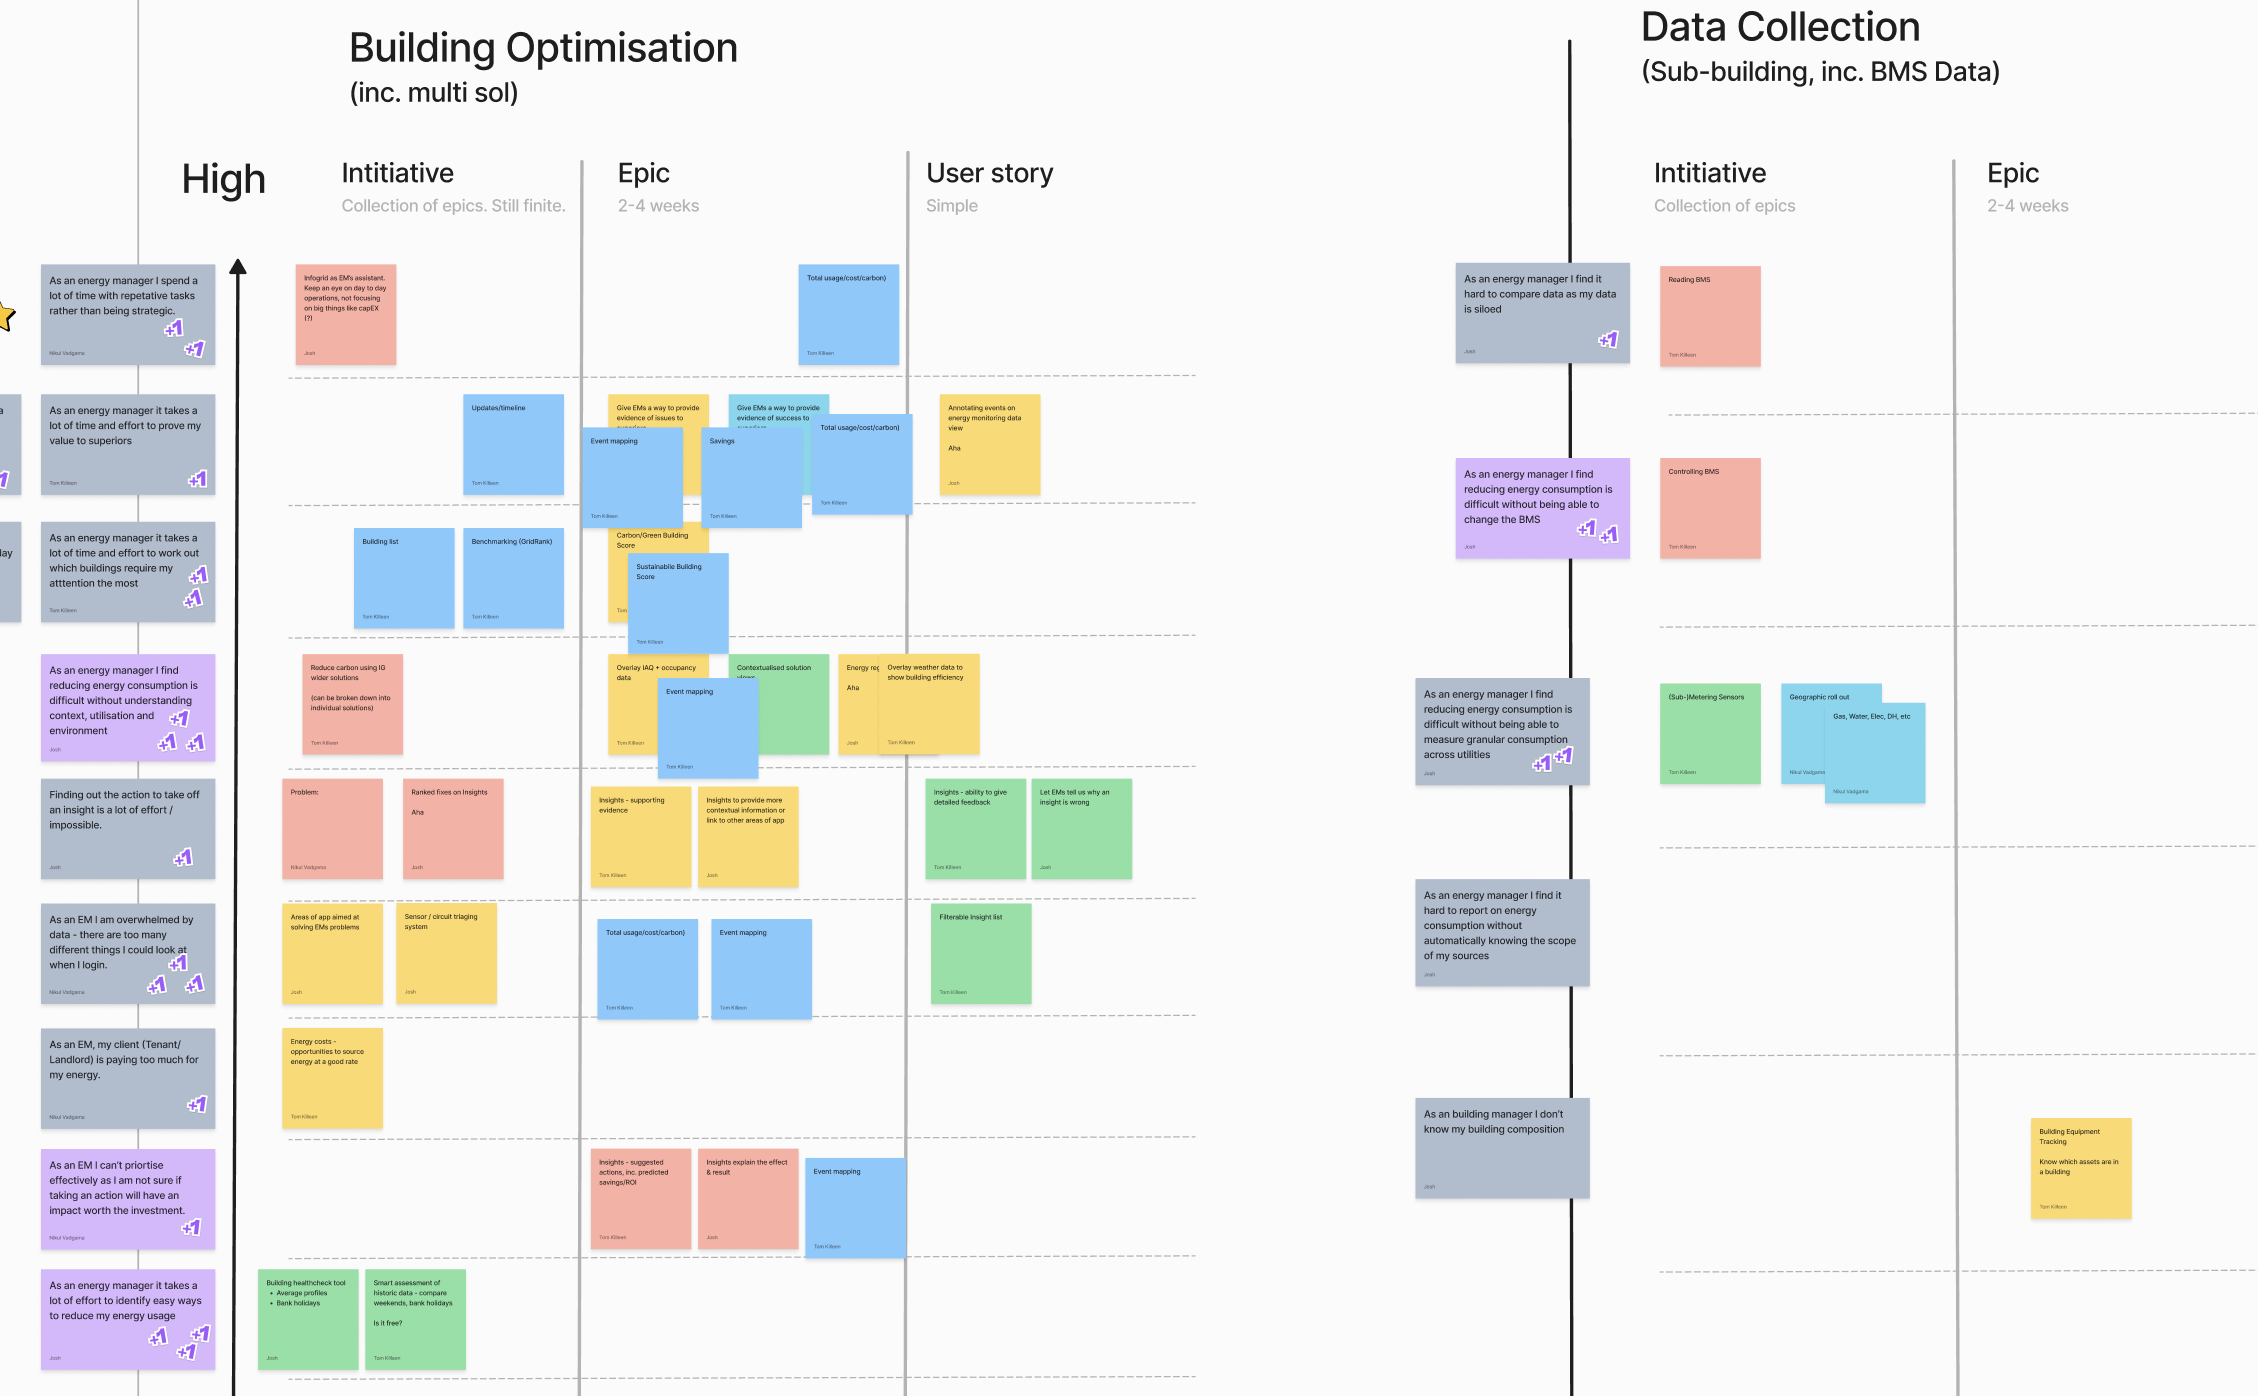
Prioriristing reduction against reporting
Leadership and delivery. I managed two designers, owned the information architecture end to end and extended Infogrid's design system. I also set up FullStory and defined the tracking, so we could measure real use from launch.
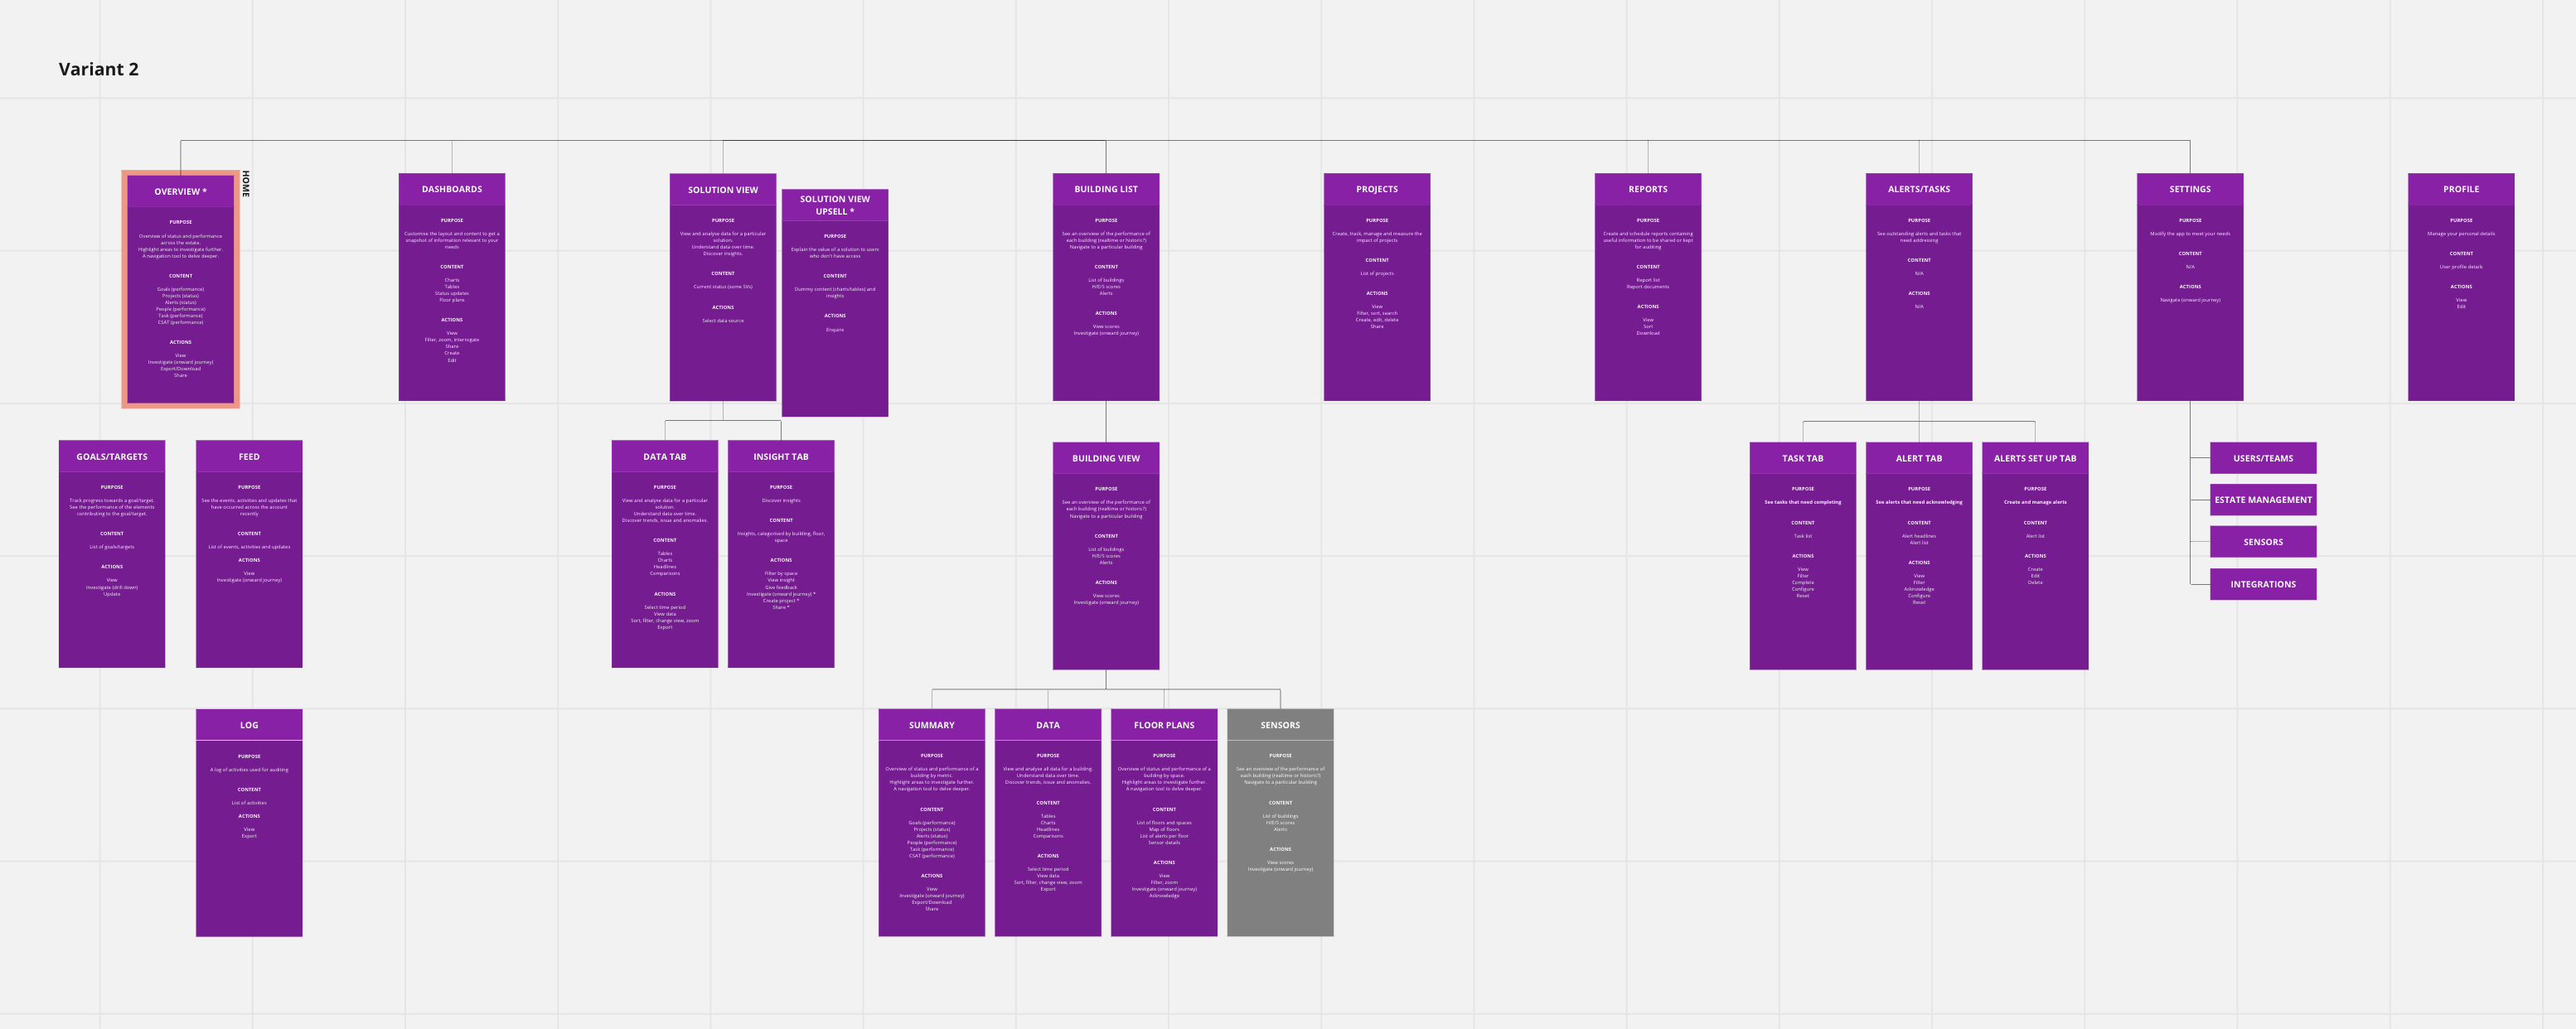
One of several site map variants created
Solution
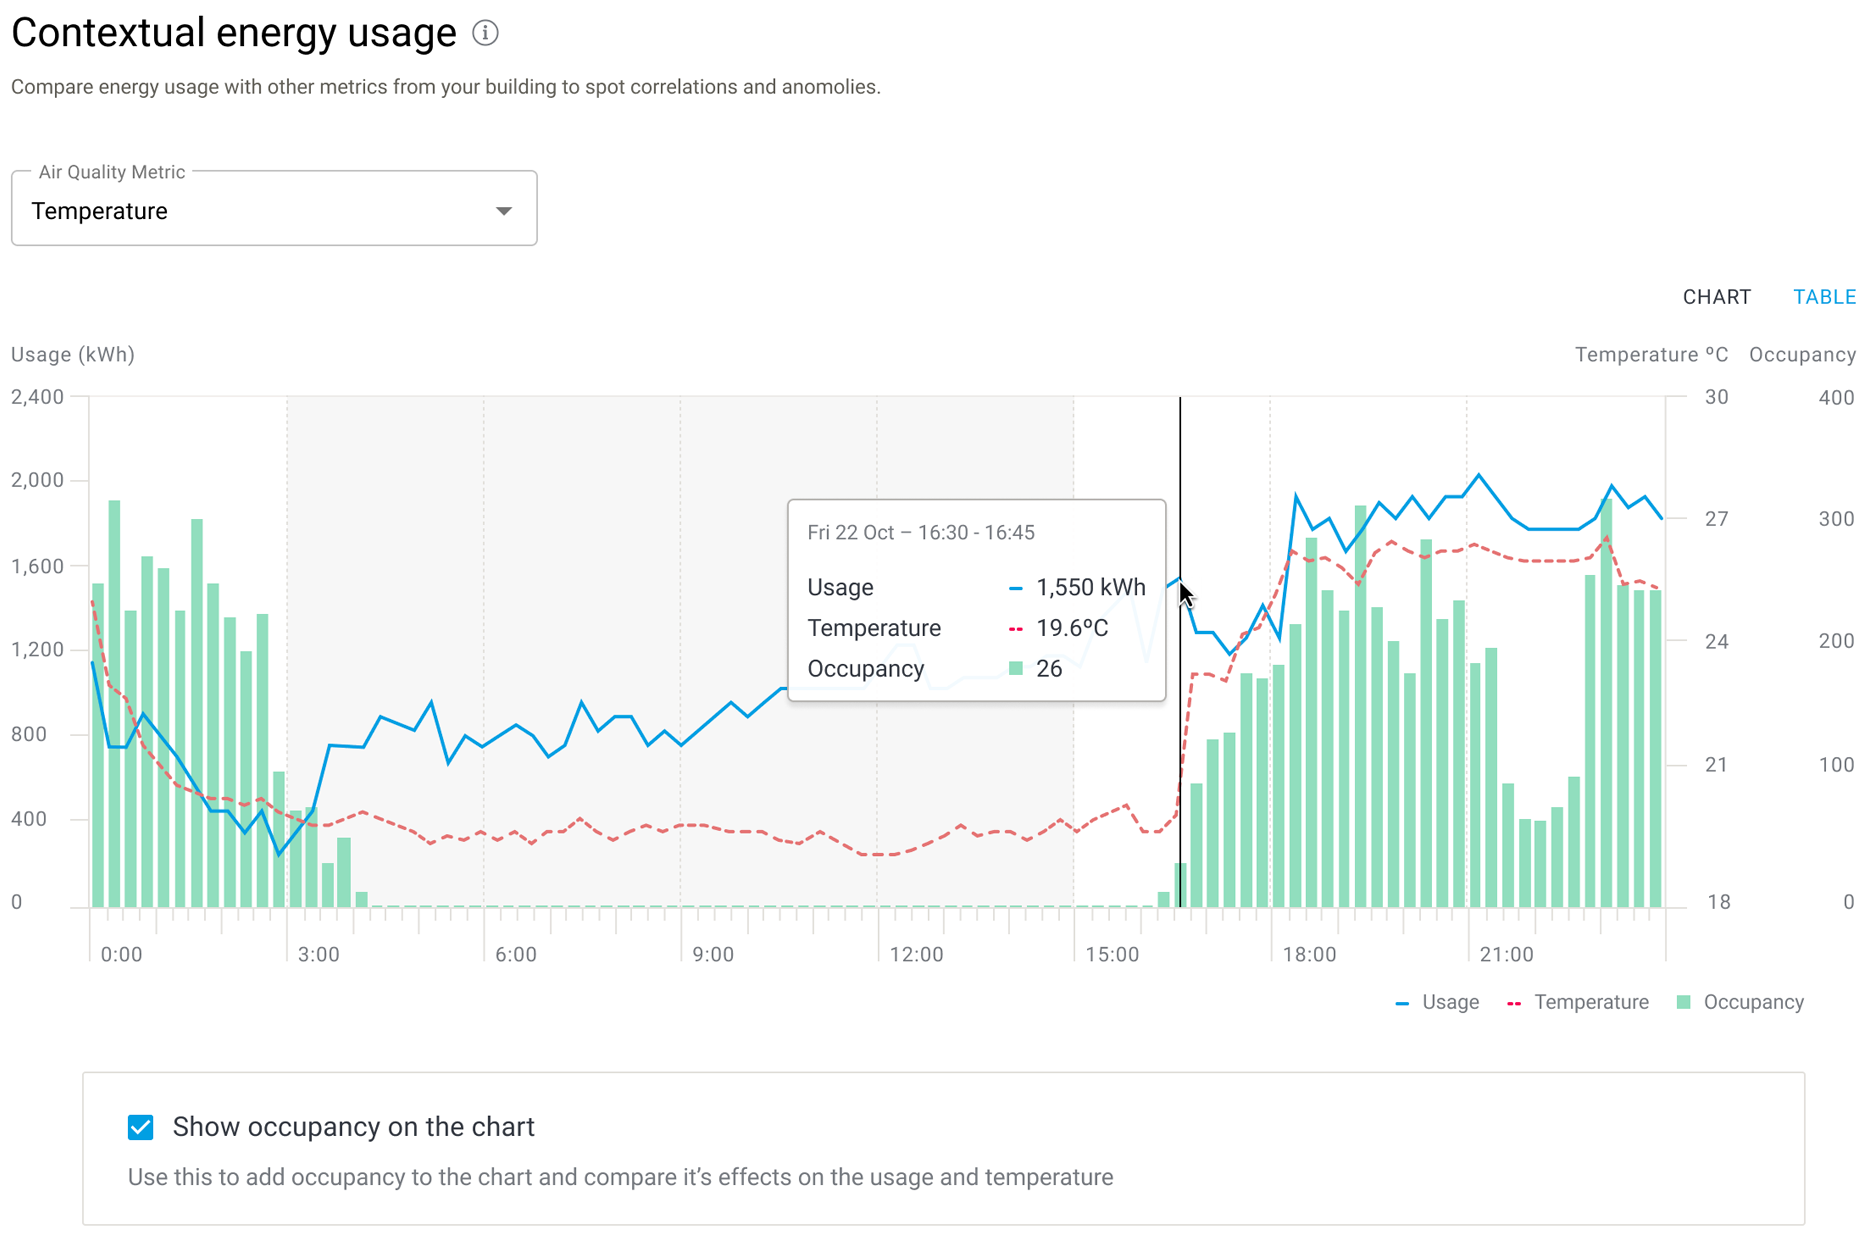
Context, not more charts. The obvious next step was more detailed consumption charts. Users told us seeing kWh alone hides waste, so I argued against it. Out-of-hours energy use only shows up next to occupancy.
It was harder to build, because it combined data from several Infogrid products, but it turned Infogrid's wider sensor network into an advantage competitors couldn't copy.
"buildings are often only half occupied... being able to tie things back and give context is really, really important, now energy costs twice as much".
Sodexo energy analyst
A score built on comparison. Industry building scores were only updated once a year, too slow to show whether day-to-day changes were working. So we set out to give every building a single score that updated daily.
Engineering leadership pushed for a simple version that would be easier to calculate. I tested that approach with energy managers and the feedback was poor: they told us performance is "all about comparing".
I used that evidence to argue for a comparison-based score, and that's what we built: a daily score from 1 to 100 against similar buildings.
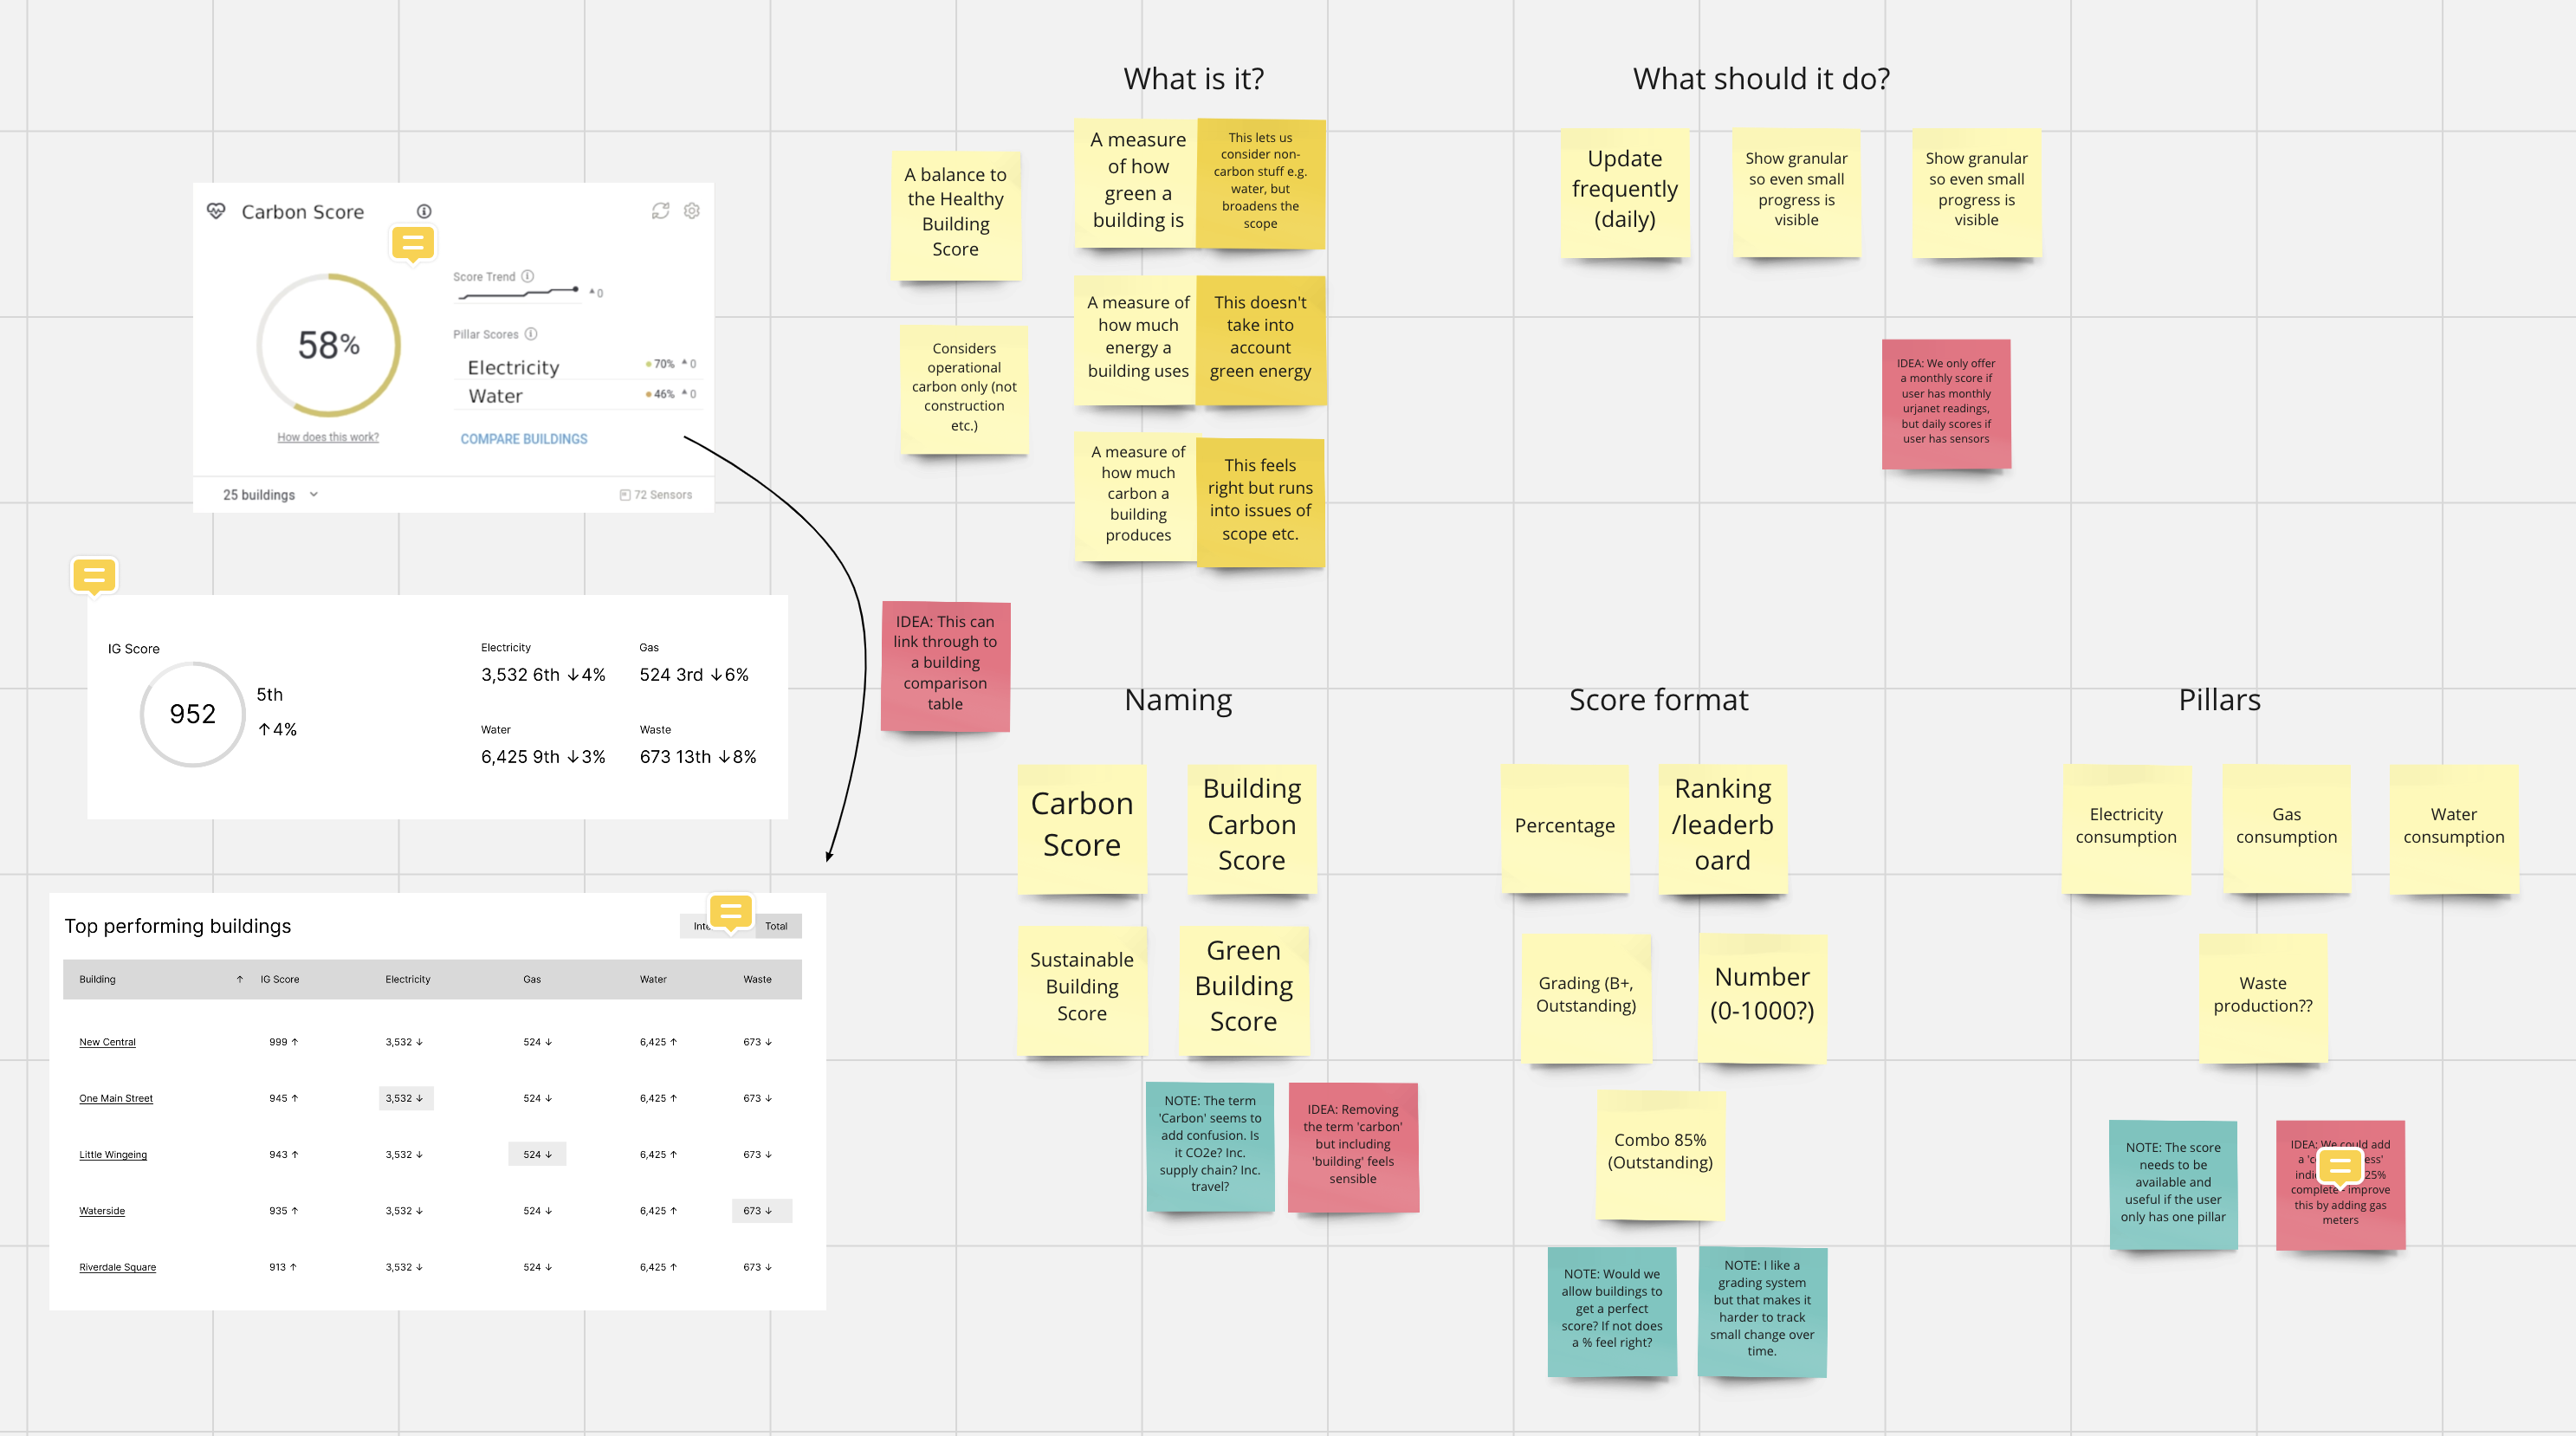
Carbon Score ideation
Designs
I designed and prototyped in Figma, working closely with the other designers, the product manager and developers. I tested concepts and detailed designs regularly with customers and with a consultant energy manager we had on retainer. For accessibility, every chart also has a table view, and colour is never the only signal: lines use different styles, and scores and changes carry numbers and arrows.
Contextual energy usage. Usage, temperature and occupancy on one chart, every 15 minutes. By highlighting periods when the temperature is controlled but occupancy is low, we can reduce energy.
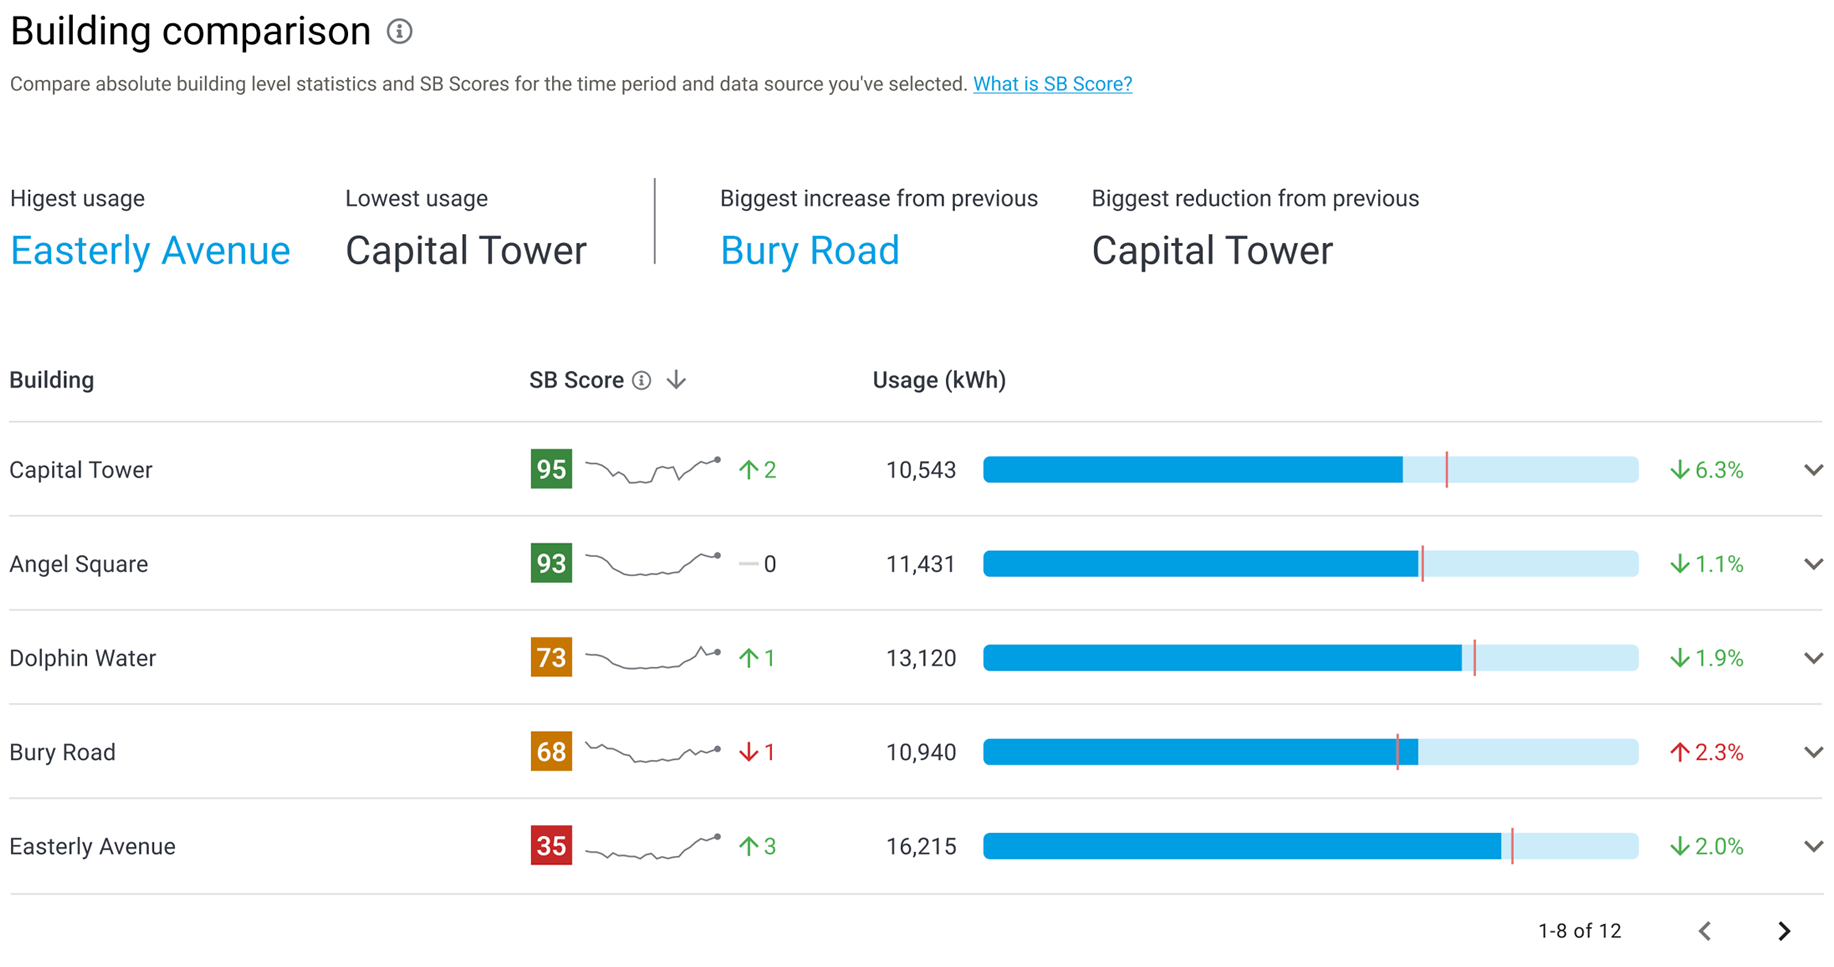
Sustainable Buildings Score. Every building ranked by its score from 1 to 100, colour-coded green, amber or red so problem buildings stand out. A sparkline shows the trend and an arrow the latest change, with each building's usage shown against a comparison marker.
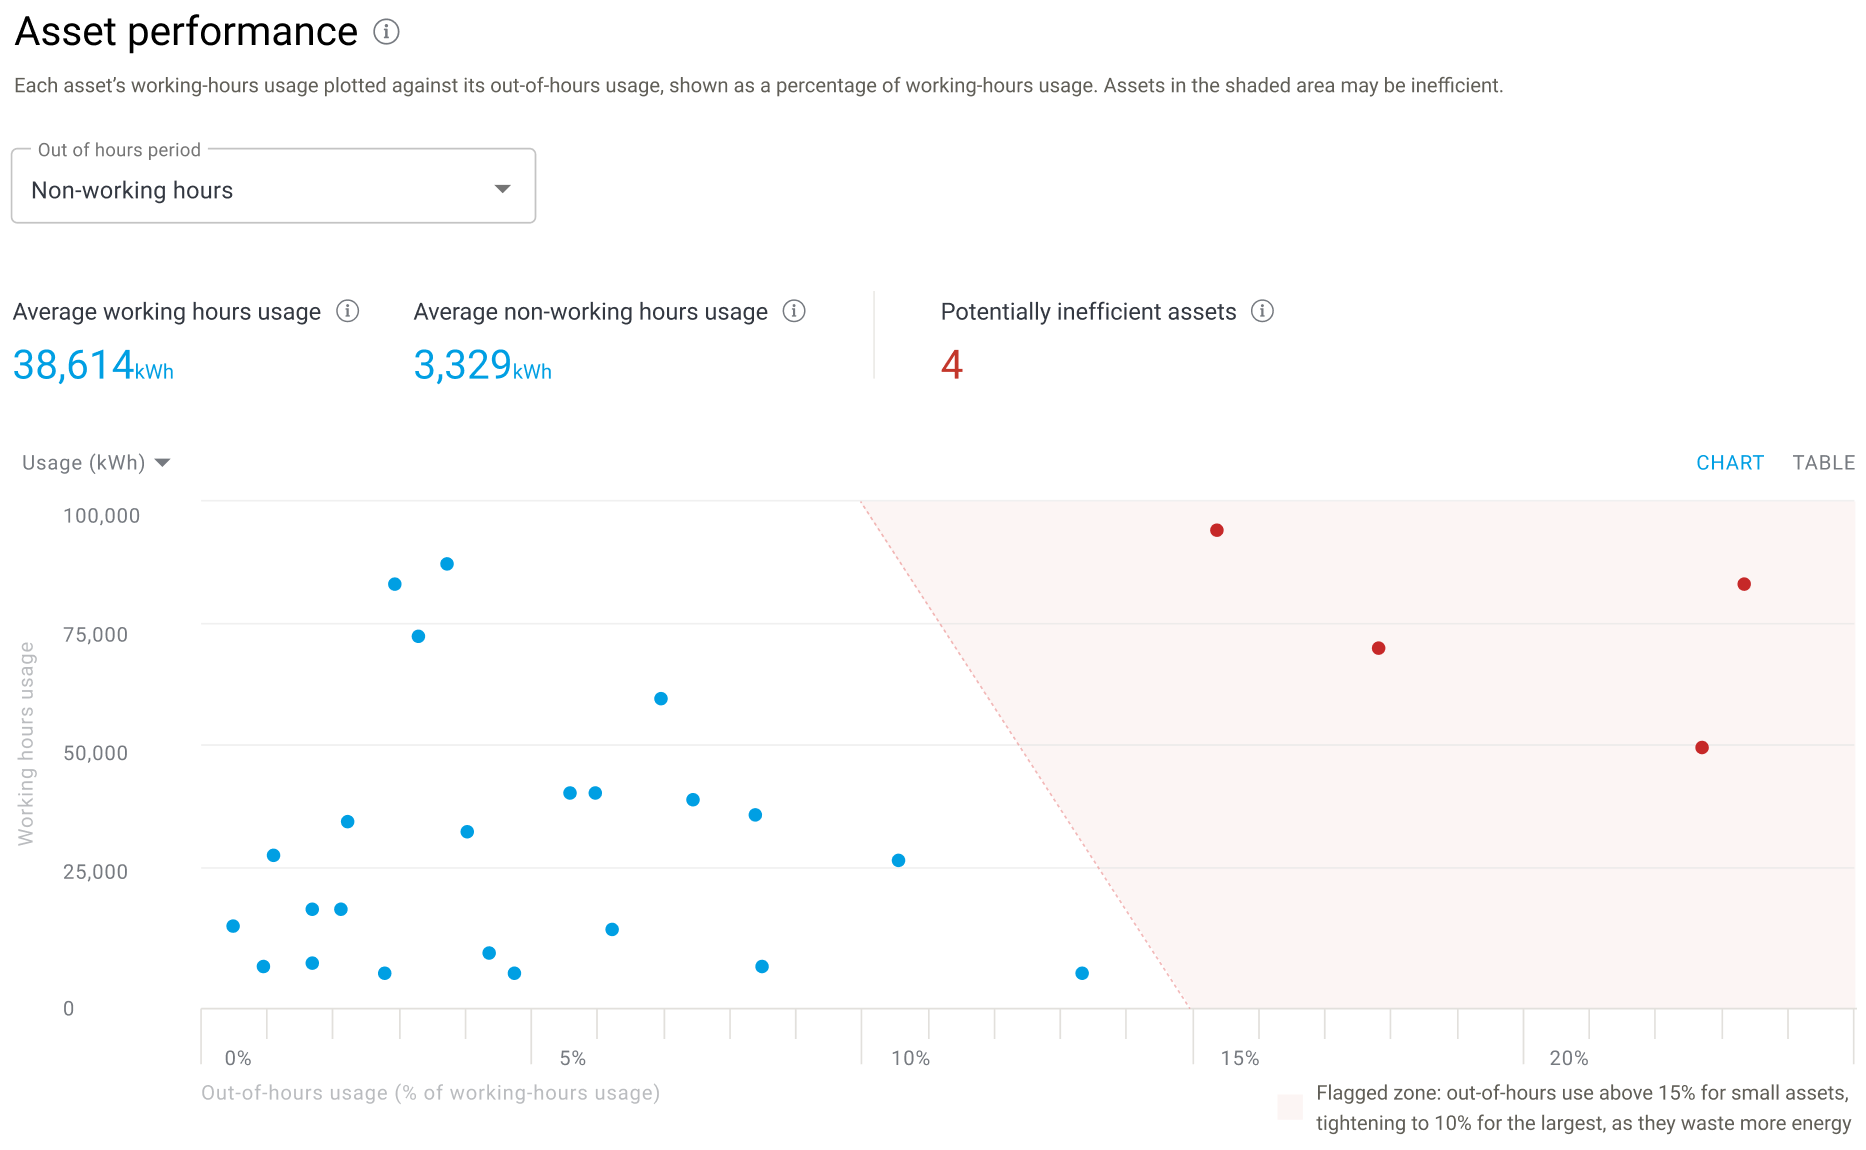
Asset performance. Each asset's working-hours usage plotted against its out-of-hours use. Anything in the shaded zone is flagged as potentially wasting energy, and the limit tightens for the biggest assets, because they waste the most.
Results
- More than 60% growth in ARR from December 2022 to July 2023
- £35k average savings per building, from fixes as simple as changing an air conditioning schedule that ran every weekend
- A £4m sales pipeline, with energy opening the door to Infogrid's wider products
- "You guys are way ahead of everybody now." Senior Energy Manager at a global property firm, on the insights
Credits
UX
Tom Killeen
Josh Gowen
Product
Nikul Vadgama
Alex Gordon-Lewis
Engineering
Filip Modrzejewski
William Di Pasquale
Data Science
Federico Garza de Leon
Felix Sanchez Garcia